Overview
Usage logs provide information on minute-by-minute logs of Flow executions, API calls, job executions, and more in the Primary Instance. This provides information like what Designer elements are executing and how much memory is used. Each timeframe shows the different Decision entities that are executing and the corresponding memory usage. This article is used to describe what information is given with each column in this file.
Location
Usage logs can be found at C:\Program Files\Decisions\Decisions Services Manager\Logs. They are called "Primary.usage".
Example
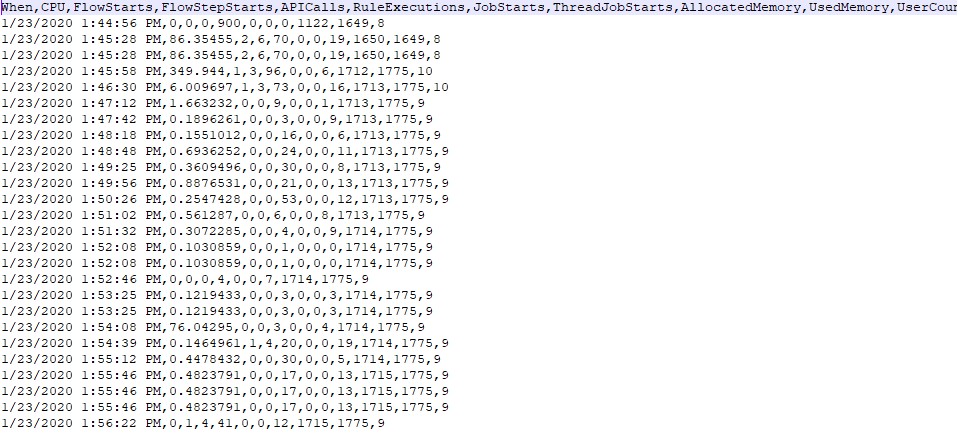
This is how the log file appears when it is opened in plain text. The top row has several different comma-separated header columns with their corresponding data below.

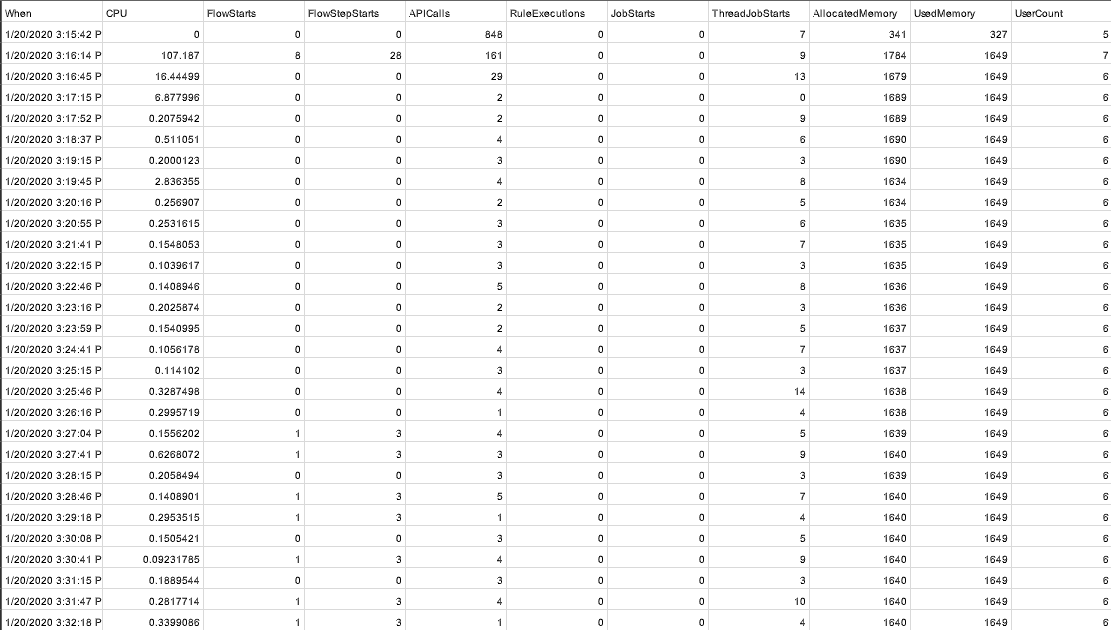
This is how the file would appear imported as a CSV file.

Column Definitions
| Column Name | Description |
| WHEN | Time Frame for the recorded period. |
| CPU | The current amount of CPU used. |
| Flow Start | The number of topmost Flows started. This count does NOT include subflows that are called from the parent Flow unless it is called via the Async linked Flow step which causes them to essentially be topmost Flows themselves. Sub flows are counted as ‘FlowStepStarts |
| Flow Step Start | The number of steps executed in the topmost Flows and all steps in any subflows that are called (regardless of if they are called sync or async). |
| API Calls | The number of API calls made between specified time. Internal API Calls that we make from our UI to SHM are also included in this count. Includes any API calls (generated rest and web service steps, custom coded steps that call APIs) |
| Rule Executions | The number of rule executions that were executed between the specified time. |
| Job Starts | The number of scheduled jobs that started between the specified time. This also includes background jobs that run in Decisions. |
| Thread Job Start | These are used internally to run procedures. The amount started between a specified time. |
| AllocatedMemory | Memory allocated for processing between specified time; Currently allocated memory. |
| Used Memory | Actual memory usage between specified time; currently used memory. |
| User Count | The number of users logged into Decisions between specified time; Currently active sessions. |
Primary.UsageDetails
As an additional method/tool used for troubleshooting Server performance issues, the Logs Folder provides both the Primary.UseDetails and Primary.Usage.CSV files.
The following files function as such:
- Primary.Usage.CSV file shows execution counts in the form of a spreadsheet, displaying When (Date/Time) the execution occurs, Count for each Type, and the amount of CPU used.

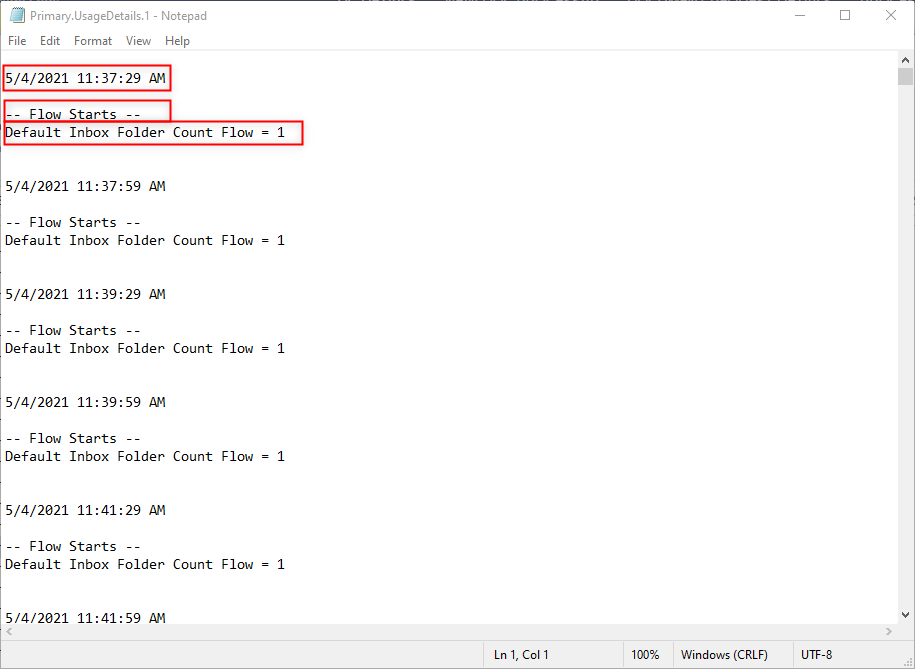
- Primary.UsageDetails breaks down each execution by displaying the Type of execution, its Name, its Count, along with the Date/Time execution occurred.
