Overview
The Profiler is designed to help Designers locate problems within their Flows and processes. The Profiler writes out and captures data on all step executions, as well as the count of executions/objects and time they took to complete the action. This information can be used by Admin Accounts to determine which parts of a system or process can be better optimized.
Administrators can view captured data from the last up to the last 20 minutes, or customize Profiler parameters to look at a more specific time frame.
This document serves as an introduction to using the Profiler as means of determining such issues, and how to access and use the Profiler from multiple points within Decisions.
Profiler Sessions may be accessed in a few ways; via the System folder by profiling a specific Flow, or through the Debugger on a Flow.
System Tools Folder
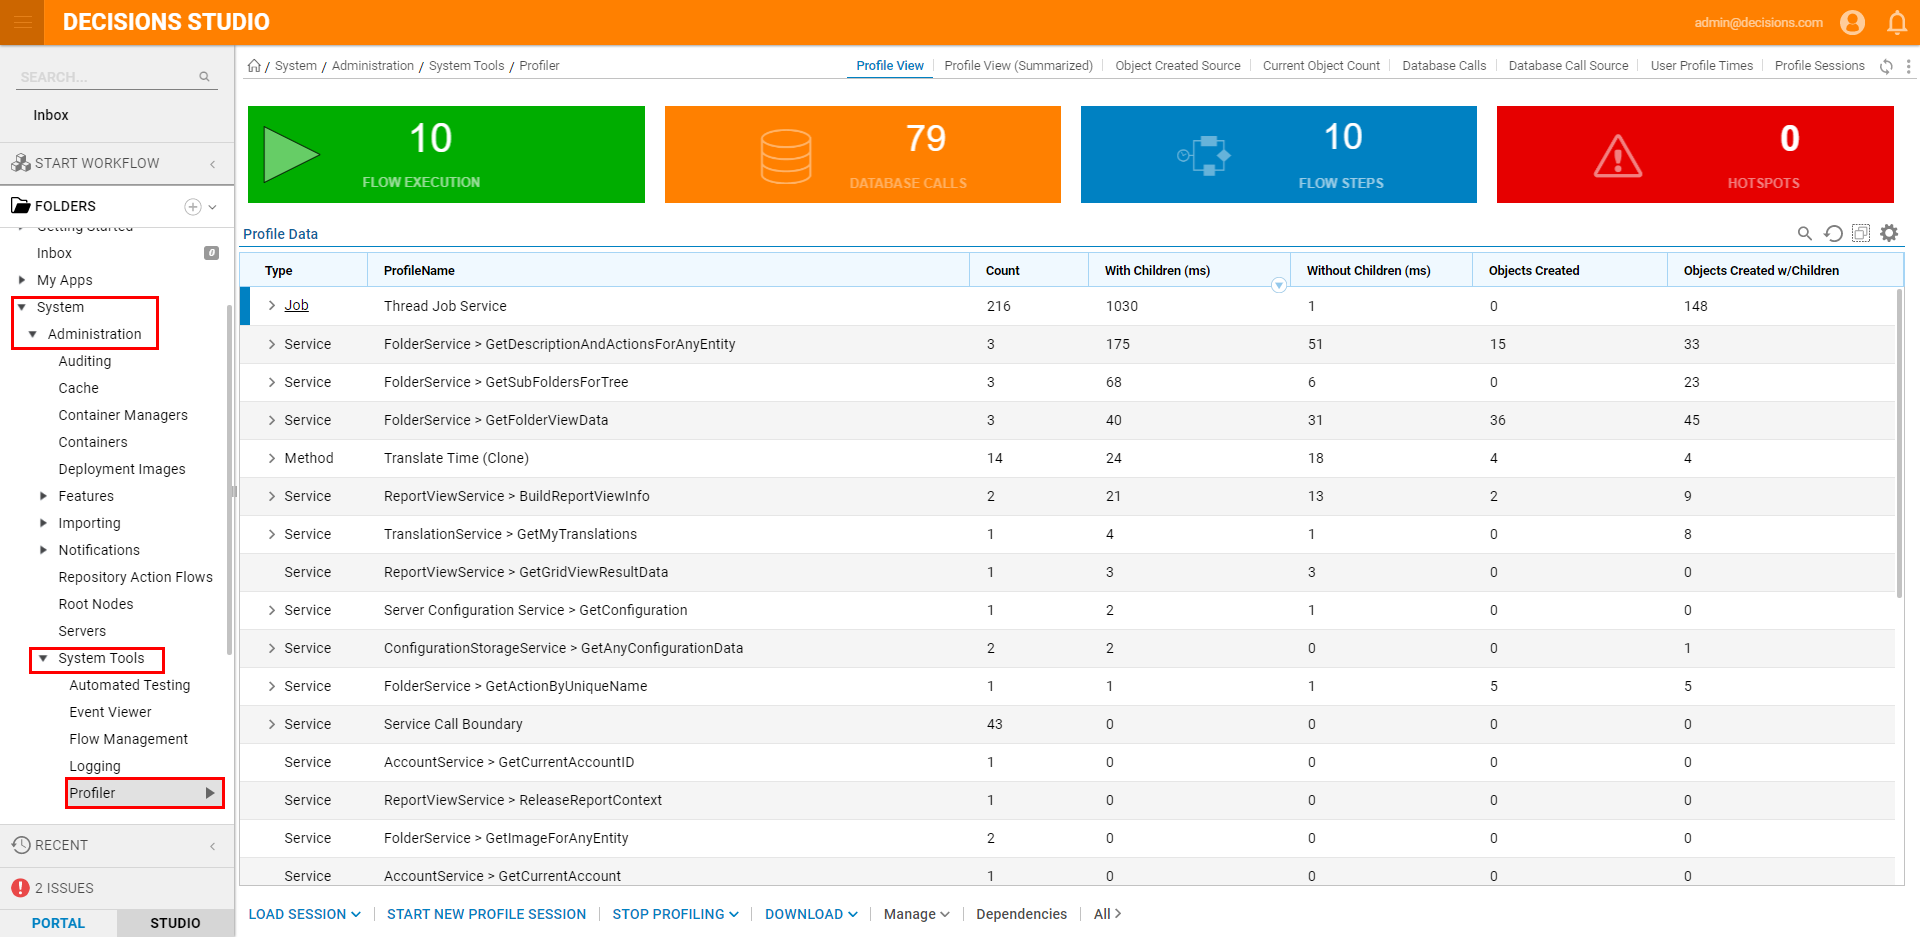
To begin the process from the System folder, navigate to System > Administration > System Tools and select Profiler.
Profile Sessions and Profile View
Due to the Profiler in 6.x running by default, users may simply view a Profile session by navigating to the Profile Sessions tab, right-clicking one of the Profile Sessions, and selecting Use.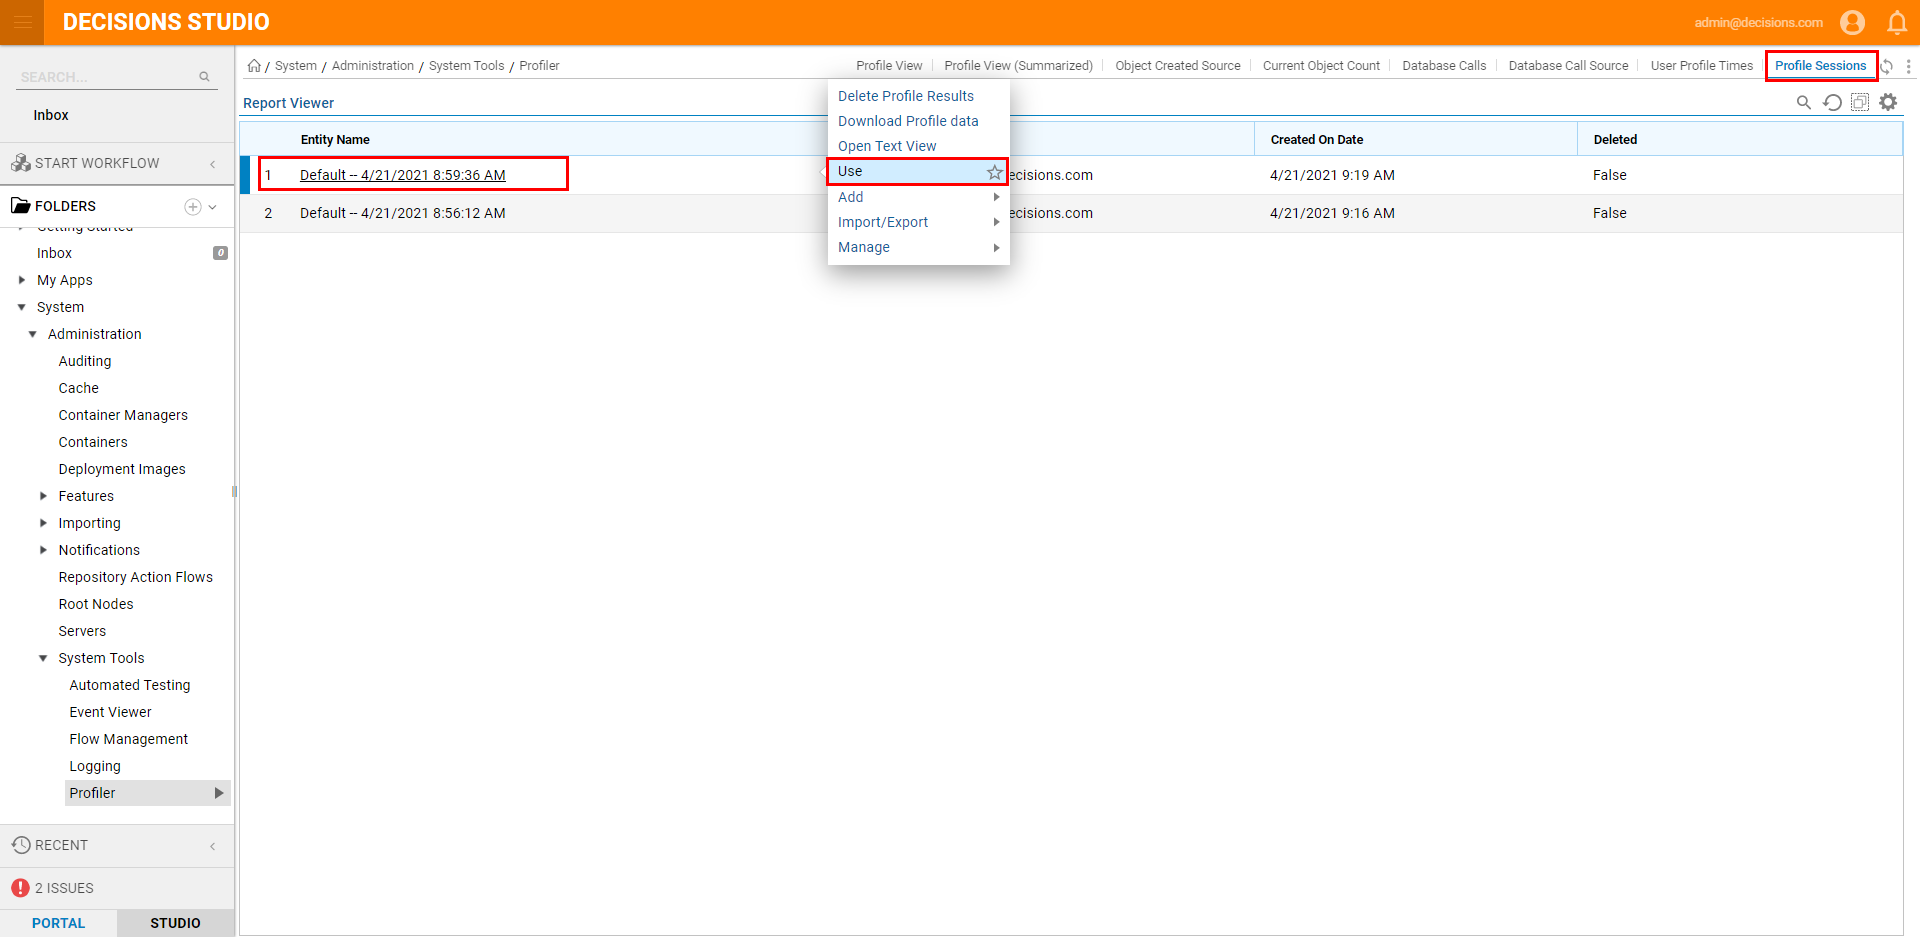
Selecting Use will cause populate the Profile View and Profile View (Summarized) tabs with Profile Data from the chosen Profile Session. From the Profile View tabs, users can view each Item's ProfileName and its Type along with the following information:
| Profile View Data | |
|---|---|
| Count | Number of executions or objects of that process. |
| With Children (ms) | Time it takes (in miliseconds) to complete the process with its sub-processes. |
| Without Children (ms) | Time it takes (in miliseconds) to complete the process without its sub-processes factored in, |
| Objects Created | Number of Objects created by the process. |
| Objects Created w/Children | Number of Objects created by the process with its sub-processes. |
| Total Time (Profile View (Summarized) only) | Amount of total time it takes to complete the process. |
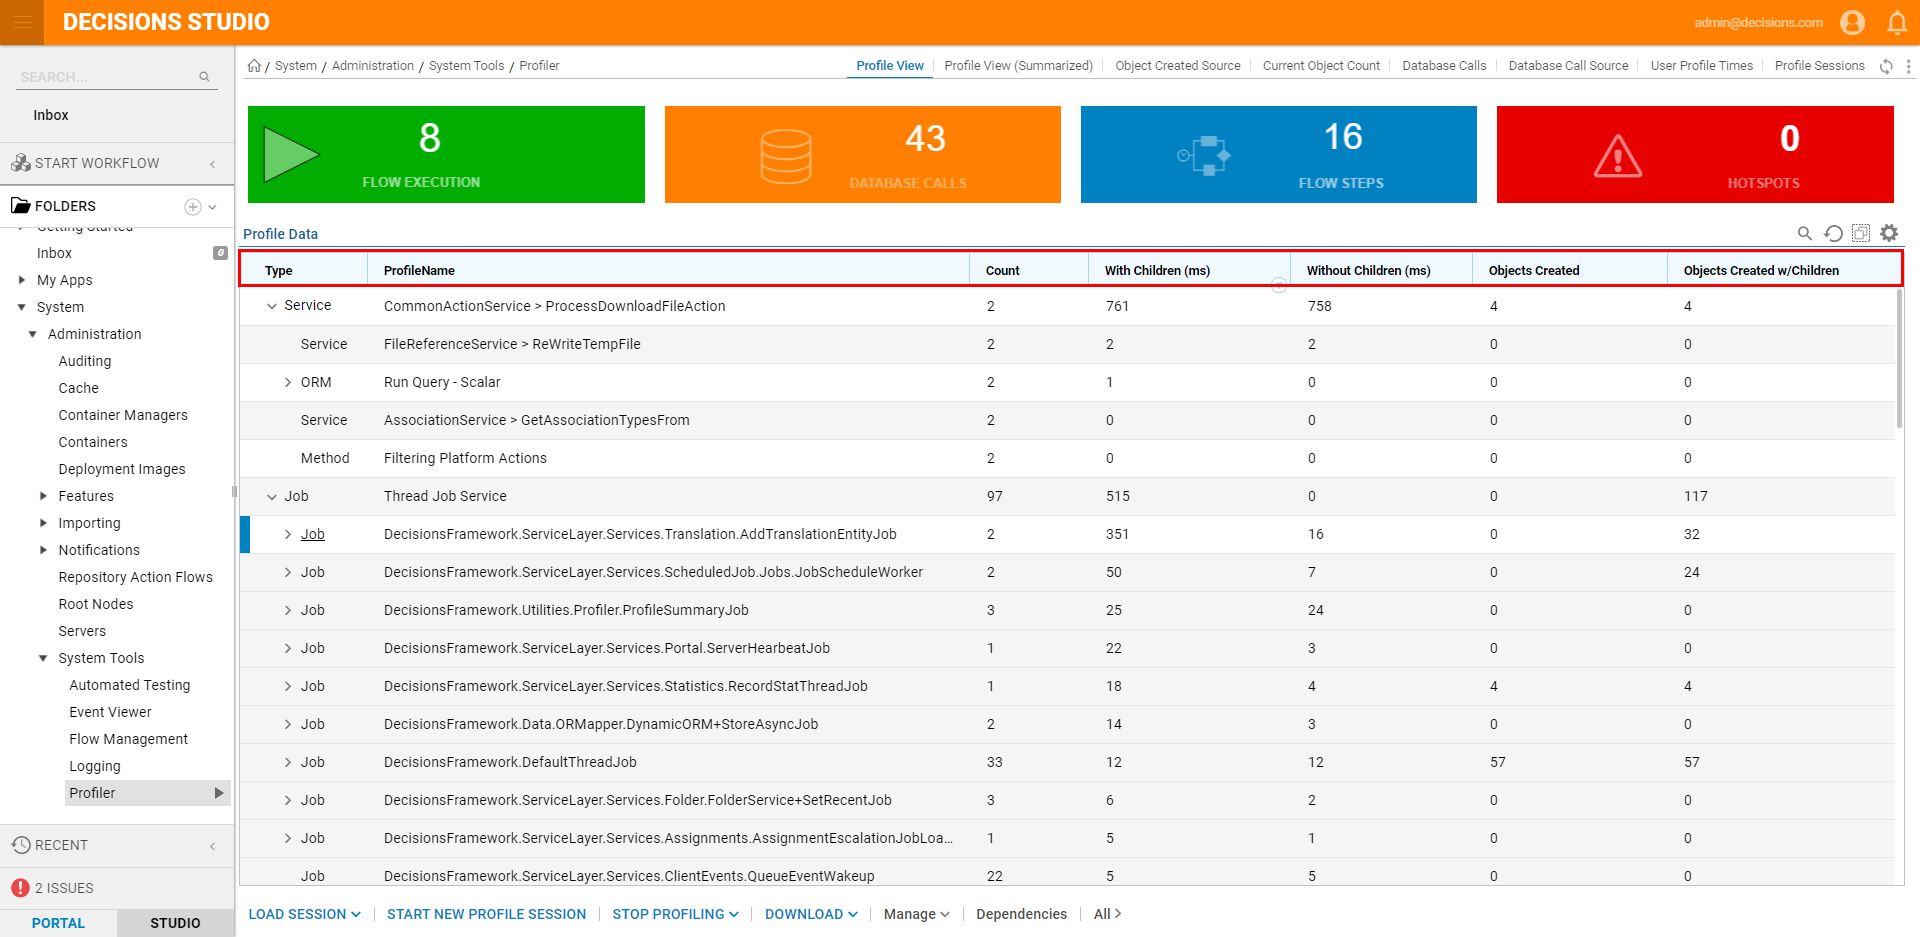
By utilizing the Profile View and Profile View (Summarized) Reports, users are able to pinpoint which items are cause the most issues within the Session.
Such information can be found by sorting the With Children (ms), Without Children (ms), Total Time, or Count columns by descending order. The top results represent the most resource-intensive processes.
Individual processes may be expanded by clicking the arrow to left of its respective Type. This helps determine instances where subprocesses may be causing an issue with its main process.
For example, in the previous screenshot, the Add Translation Entity Job appears to be the most resource-intensive element of the Thread Job Service.
Show Children
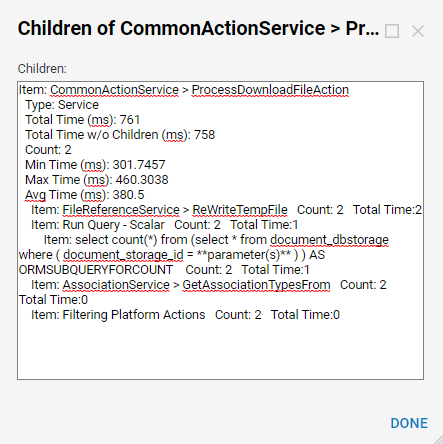
The Profile View tab only displays the top-level items. To view data for a process' Children (subprocesses) right-click an item in the Report and select Show Children. 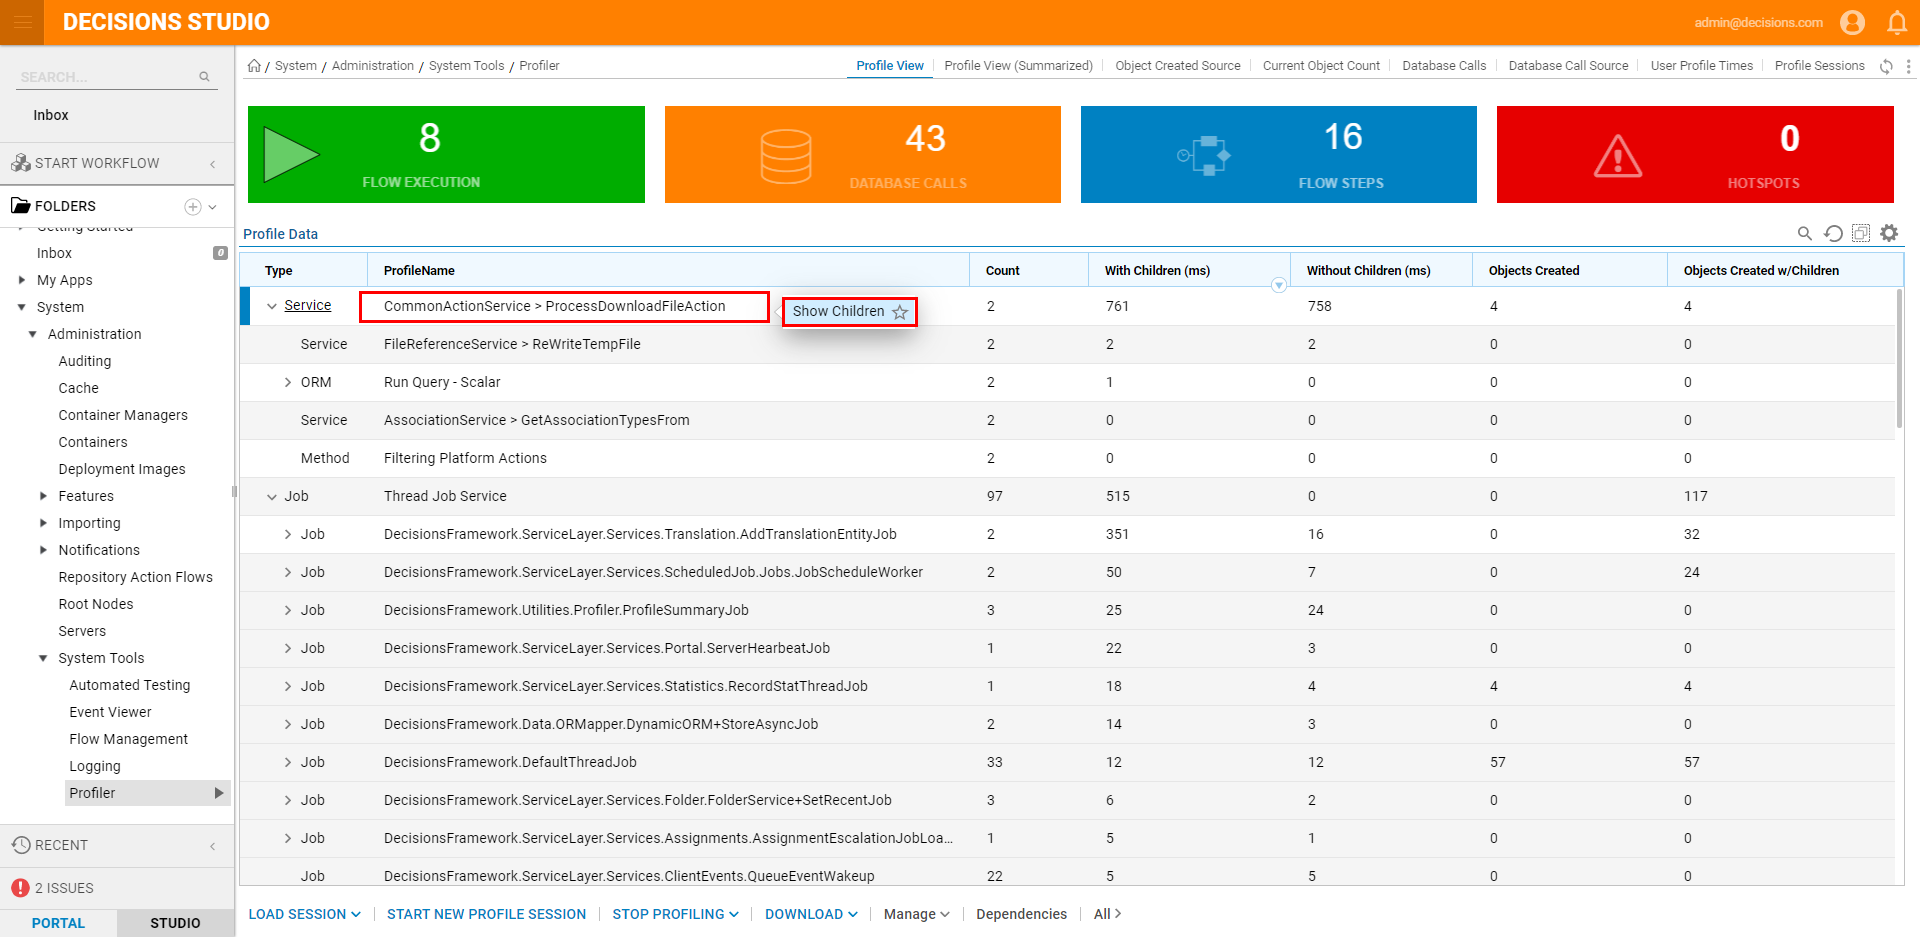
This will open the Children in a simple text view box.
New Profile Session
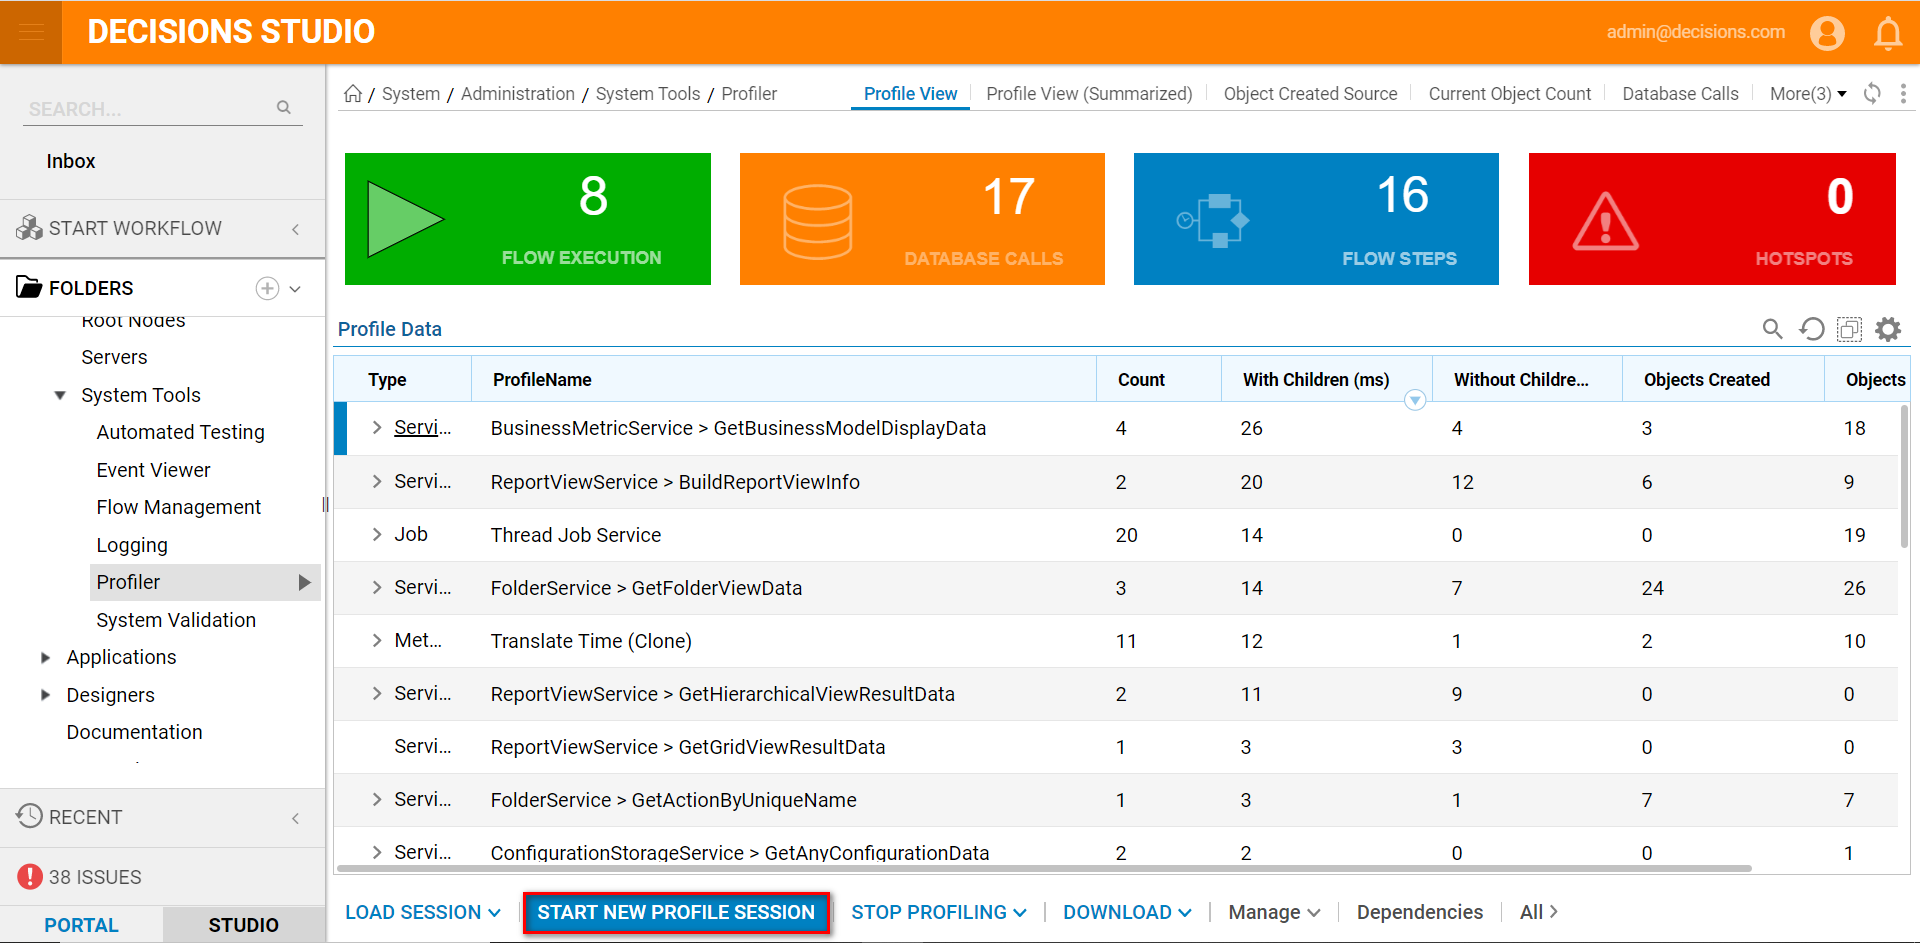
To configure a new profiling session from the Profile View tab, click START NEW PROFILE SESSION on the bottom Action bar.
The Profile Data window will appear with different configuration options. 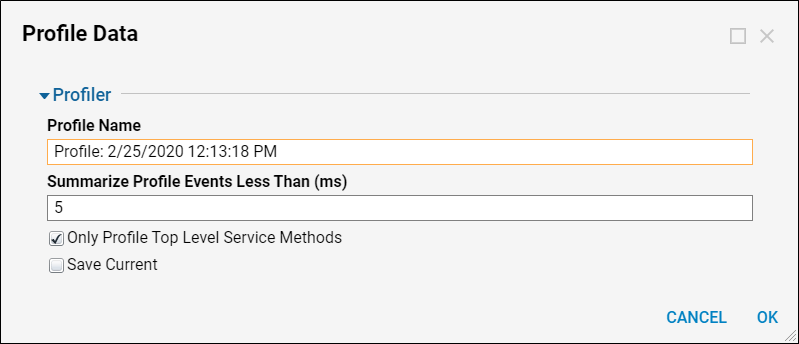
In 6x installations before v.6.14. the Profiler runs continuously by default. so the Profile Session Max Length has been removed.
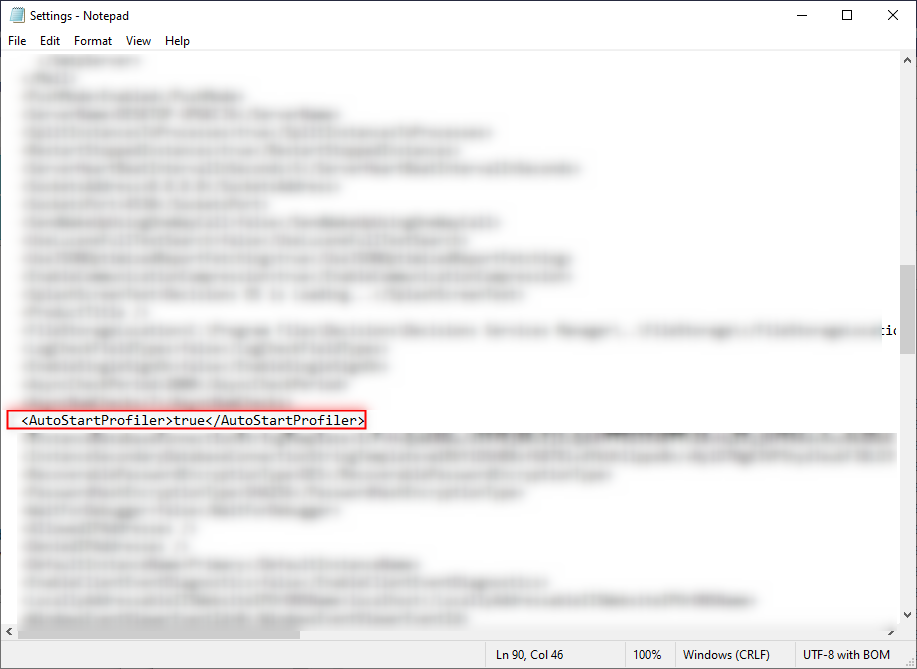
These configurable options are as follows:
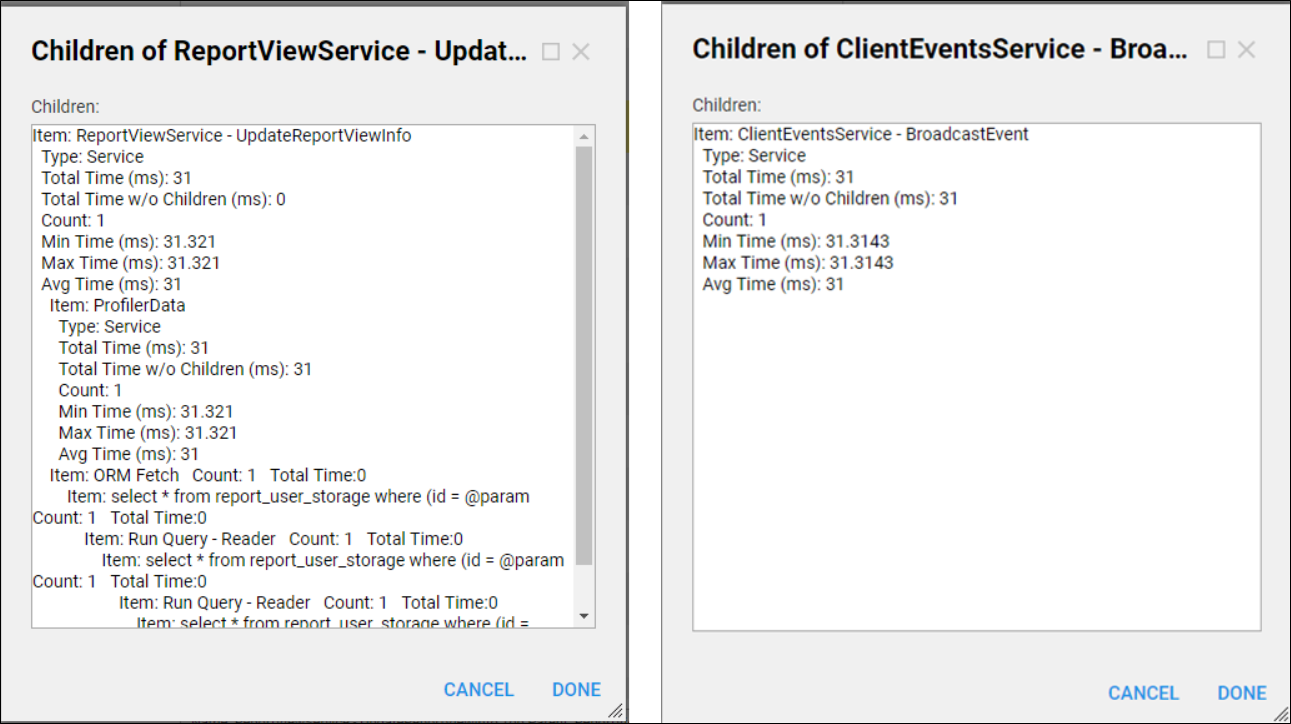
- Summarize Profile Events Less Than (ms): This is asking to set the speed in milliseconds, and if a Profile Event is recorded in less time than 5 milliseconds, the details will be summarized.
The screenshot to the left represents a summarized view, while the screenshot to the right represents a non-summarized view.
- Only Profile Top Level Service Methods: This setting will exclude any web service calls in child processes.
Upon clicking OK, the Profile Session begins running.
Stop Profiling
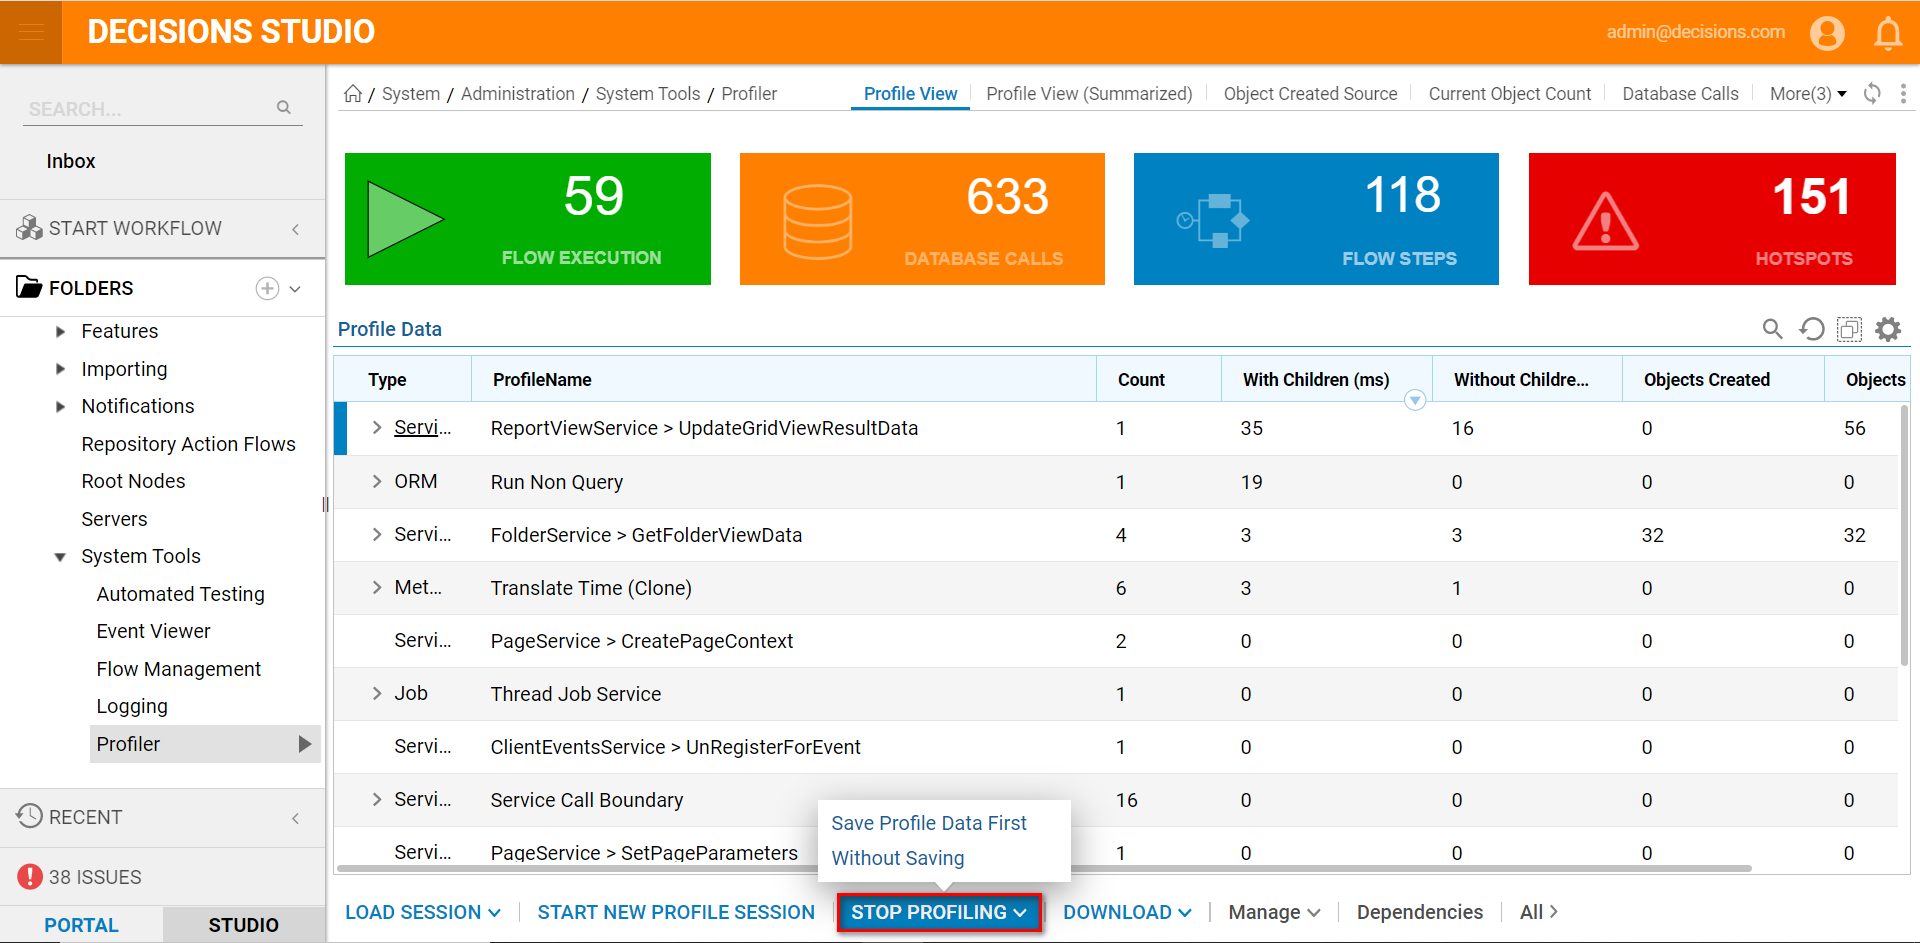
While the Profiler is running, use the STOP PROFILING options in the bottom Action Bar for options to Stop/Save Profile Data First or Stop/Without Saving (Stop Without Saving will not record Profile Data).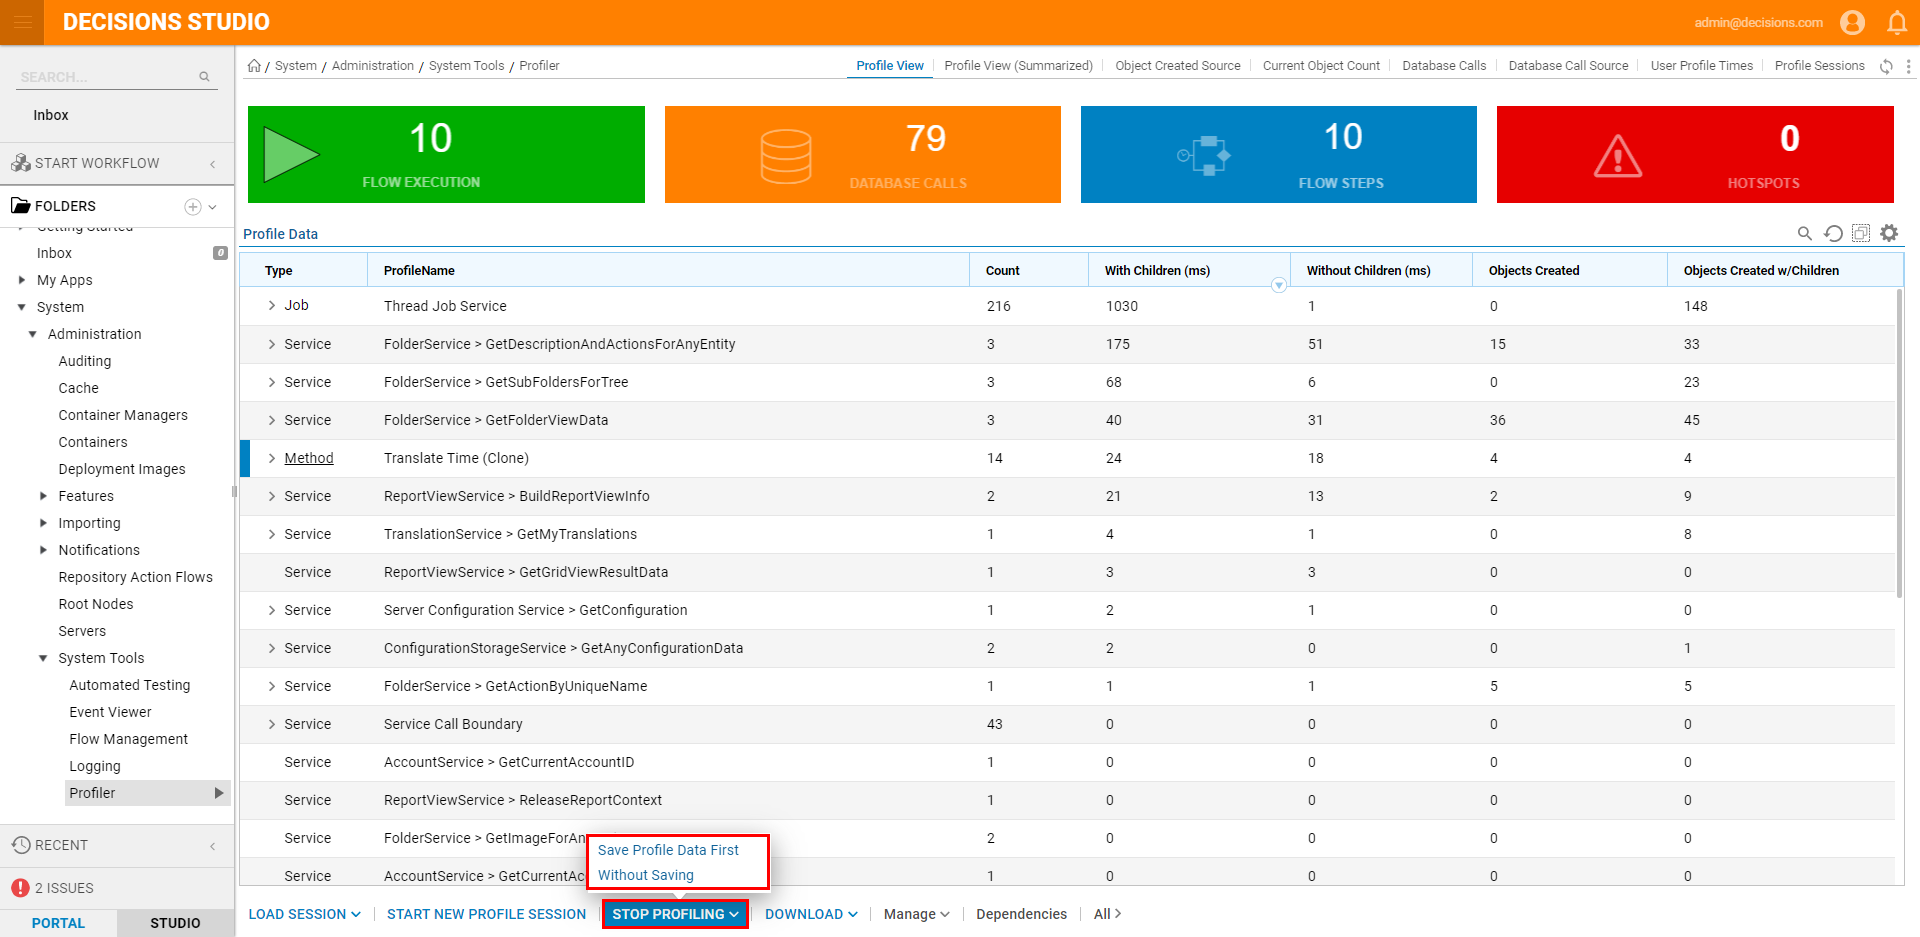
After stopping the Profiling session, the data will appear under the Profile Sessions tab.

There are three primary actions in the Action Menu for this recorded Profile Data.
- Download Profile Data: This downloads a file that can be loaded into the Decisions Profiler to be viewed. This is a good option for sharing Profile Data with Decisions support.
- Open Text View: This downloads a text file that lists out all of the Profile Data.
- Use: This loads the profile data into the profile report view on the right side of the screen. This displays the same data that is in the text file, except for it's loaded in the Decisions Portal.
Text View
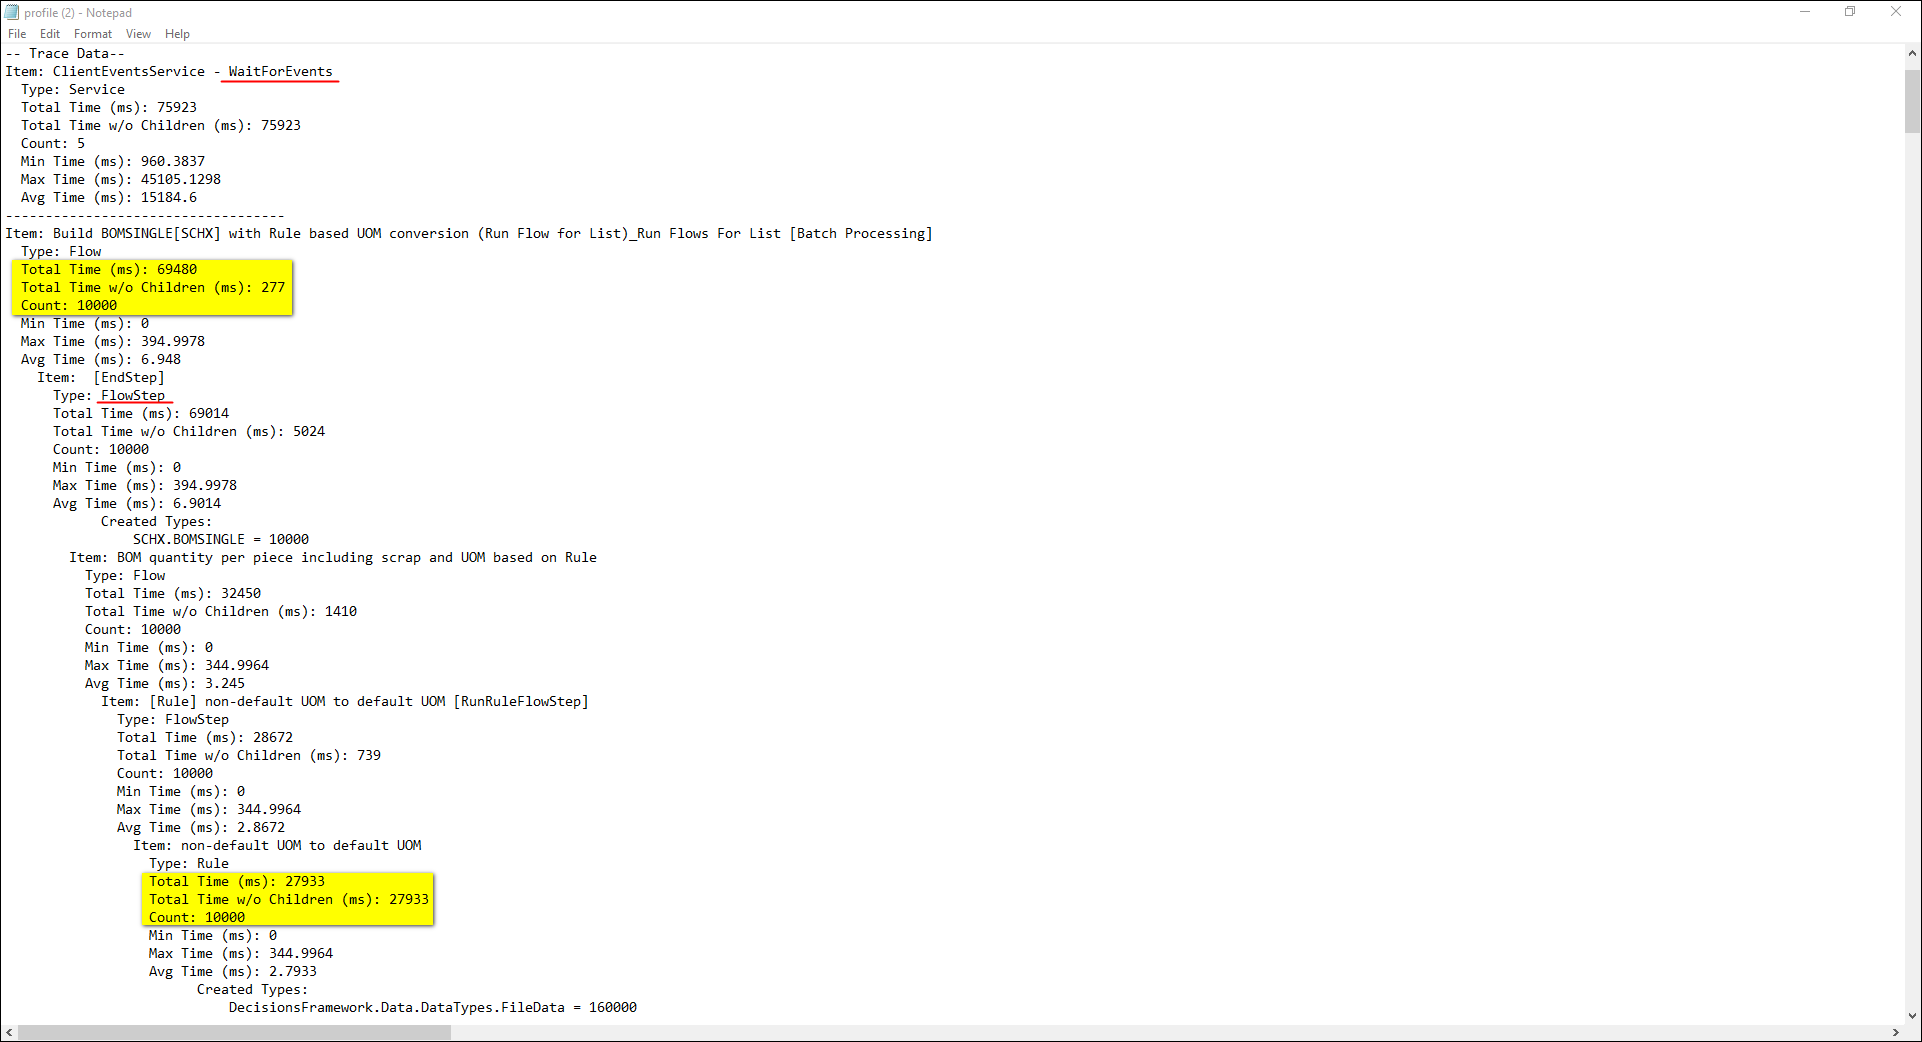
Selecting Open Text View will download the Session as a text file. For the example text file in the screenshot below, a Flow is being called by a Rule that is running within the Flow. It is important to note that these items are nested within each other. This is indicated by indentations within the text file.
This example demonstrates a Flow that was called has a Total Time of 69480 ms and the Total Time w/o Children is 277 ms, the gap in these two numbers is what needs to be evaluated. To find what is taking the longest, look for the Item that Total Time and Total Time w/o Children have close together or equal.
In this text file notice there's a Rule with a Total Time that is 27933 ms and a Total Time w/o Children that is also 27933 ms. In this example, this Rule is the reason the Flow is running slow.
Profile Flow
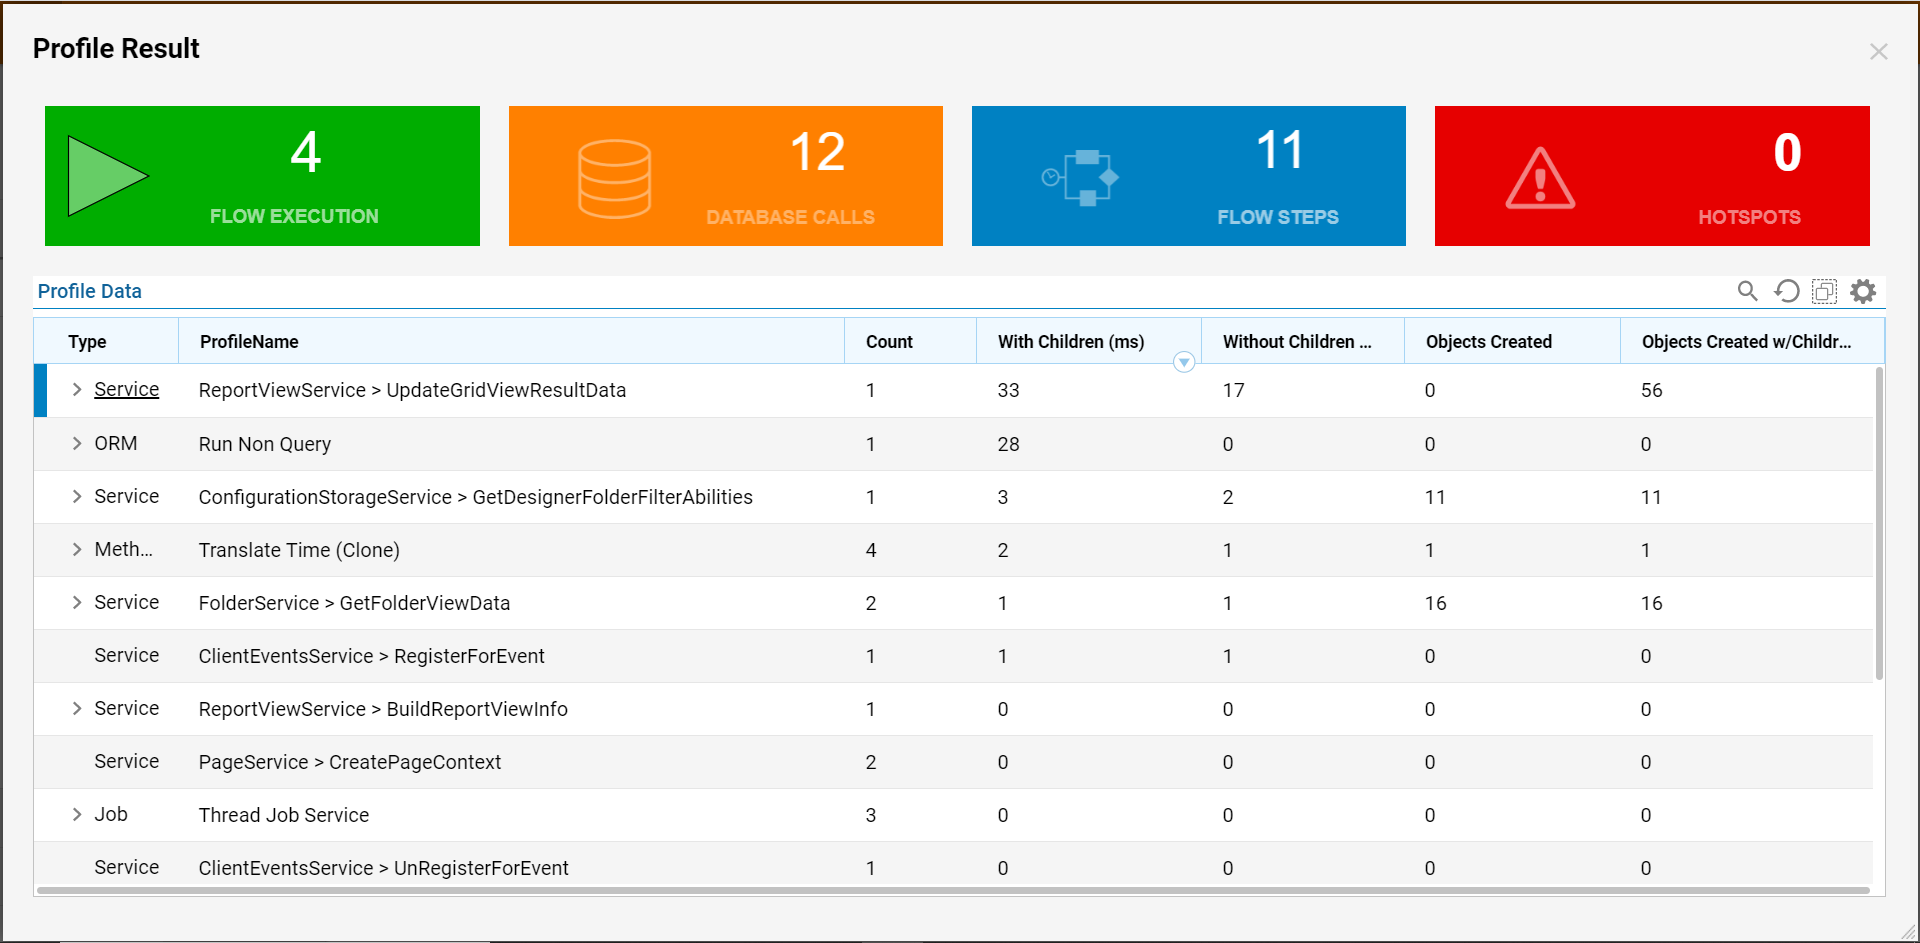
In addition to profiling the entire system, users may utilize a special action to view profiling details on a specific Flow.
To profile a Flow, click STOP PROFILING on the bottom Action bar of the Profiler, then select the desired Data Save method.
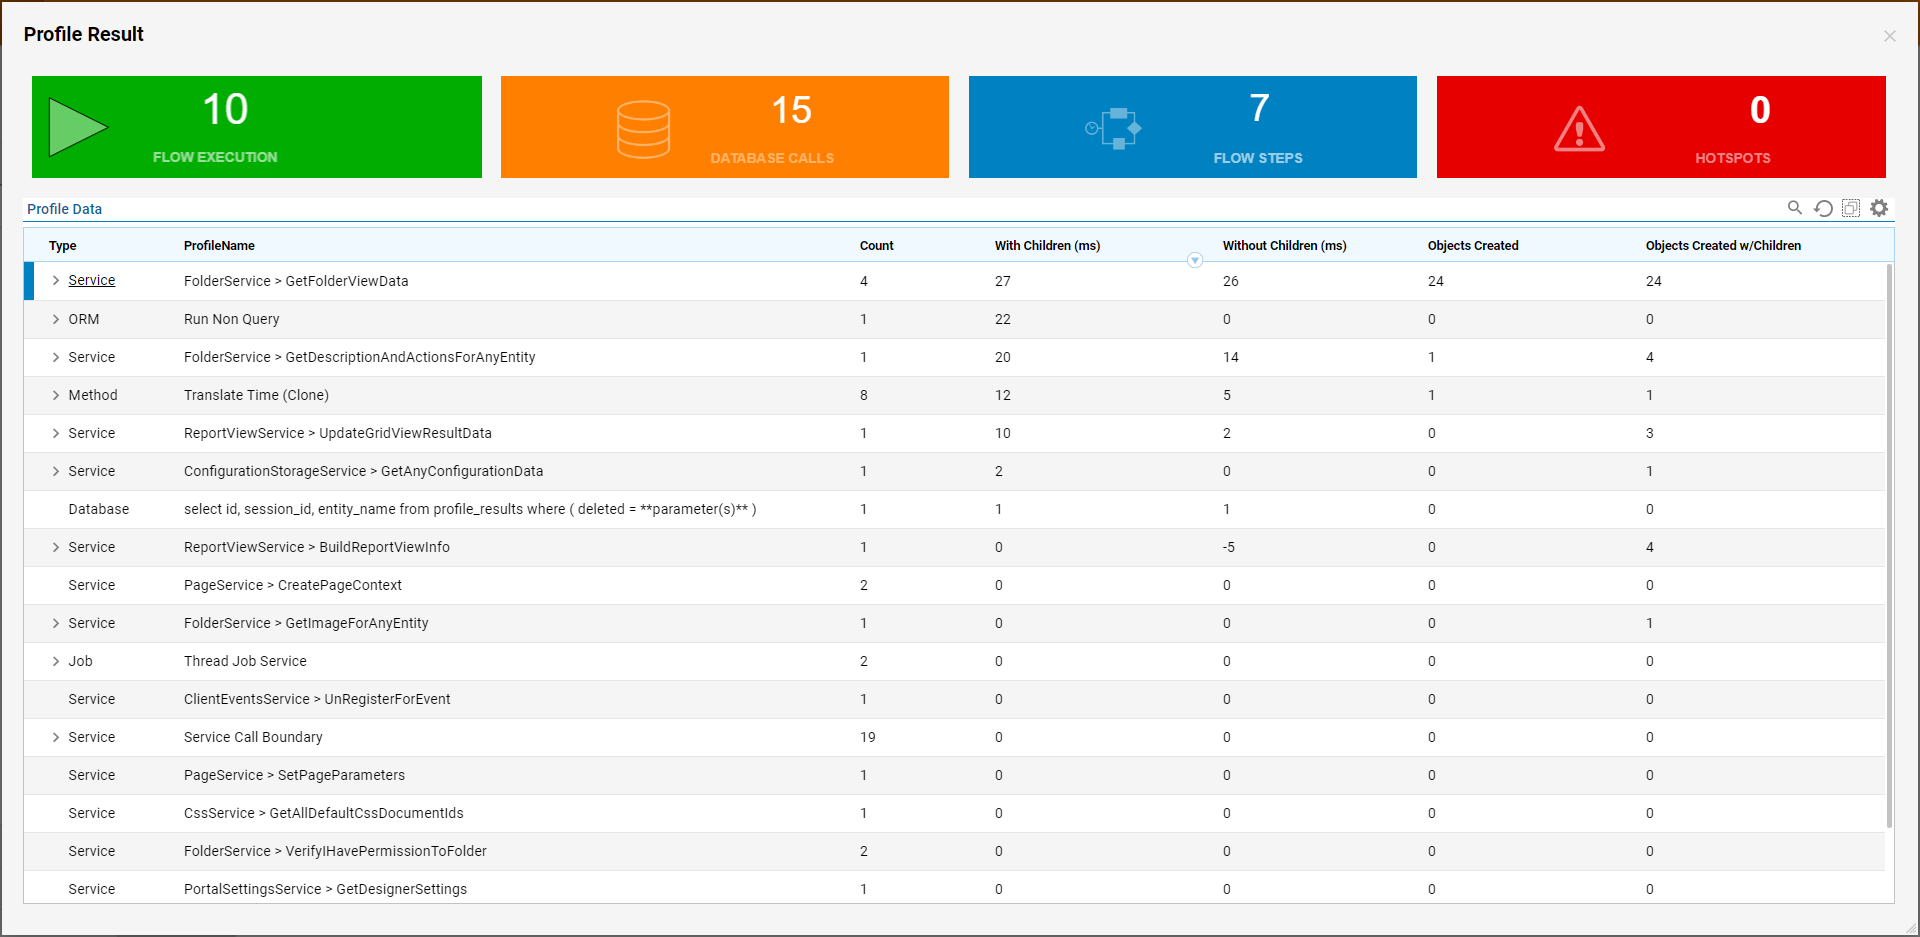
Next, navigate to and right-click on the desired Flow and select Run [Advanced] > Profile Flow. 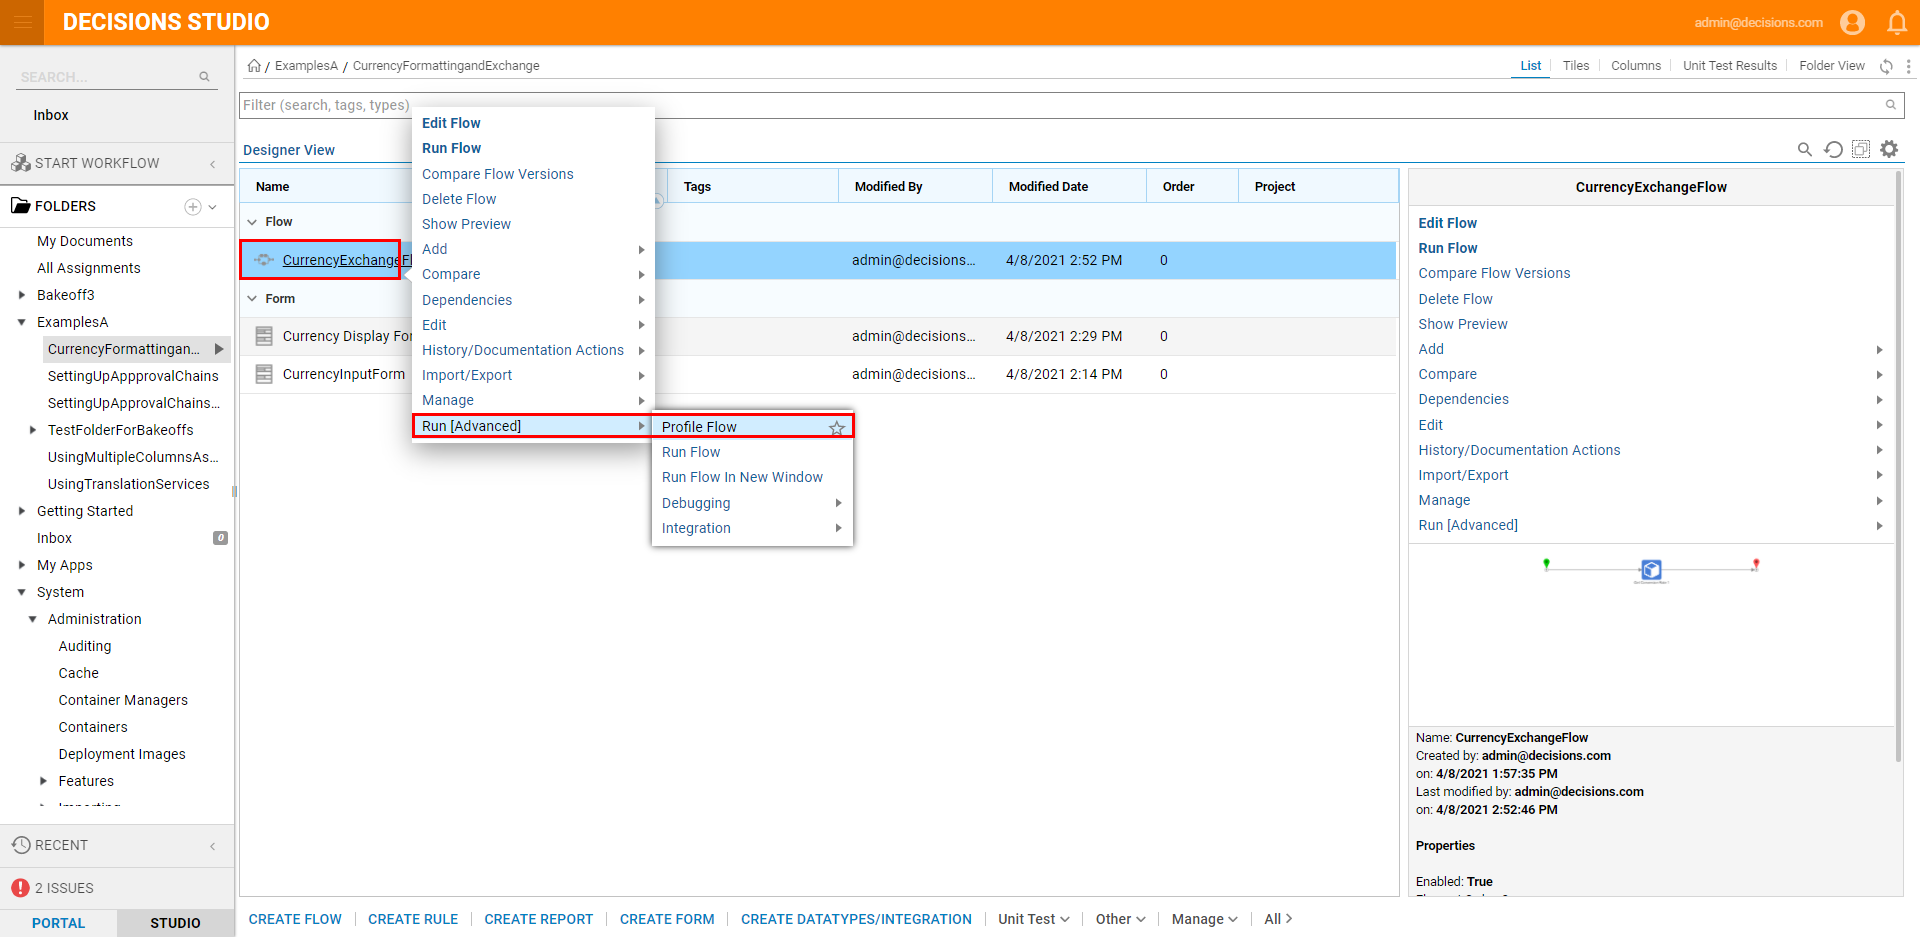 This will then pull up the results page for the Profile of the Flow.
Debugger
In addition to accessing the Profiler through way of the System Tools Folder and via the Profile Flow action, users may use the Profiler within the Debugger.
To initiate the Profiler from the Debugger, first stop the current Profiling Session from within the Profiler.

Then, from a Flow open in the Flow Designer, click the arrow beside the Debug link on the top Action bar, and select Profile Flow.

Similar to how using Profile Flow on a Flow acts, a results page for the Debugger's Profiler will appear, displaying Profile information pertaining to the Flow that the action was enacted on.
