Overview
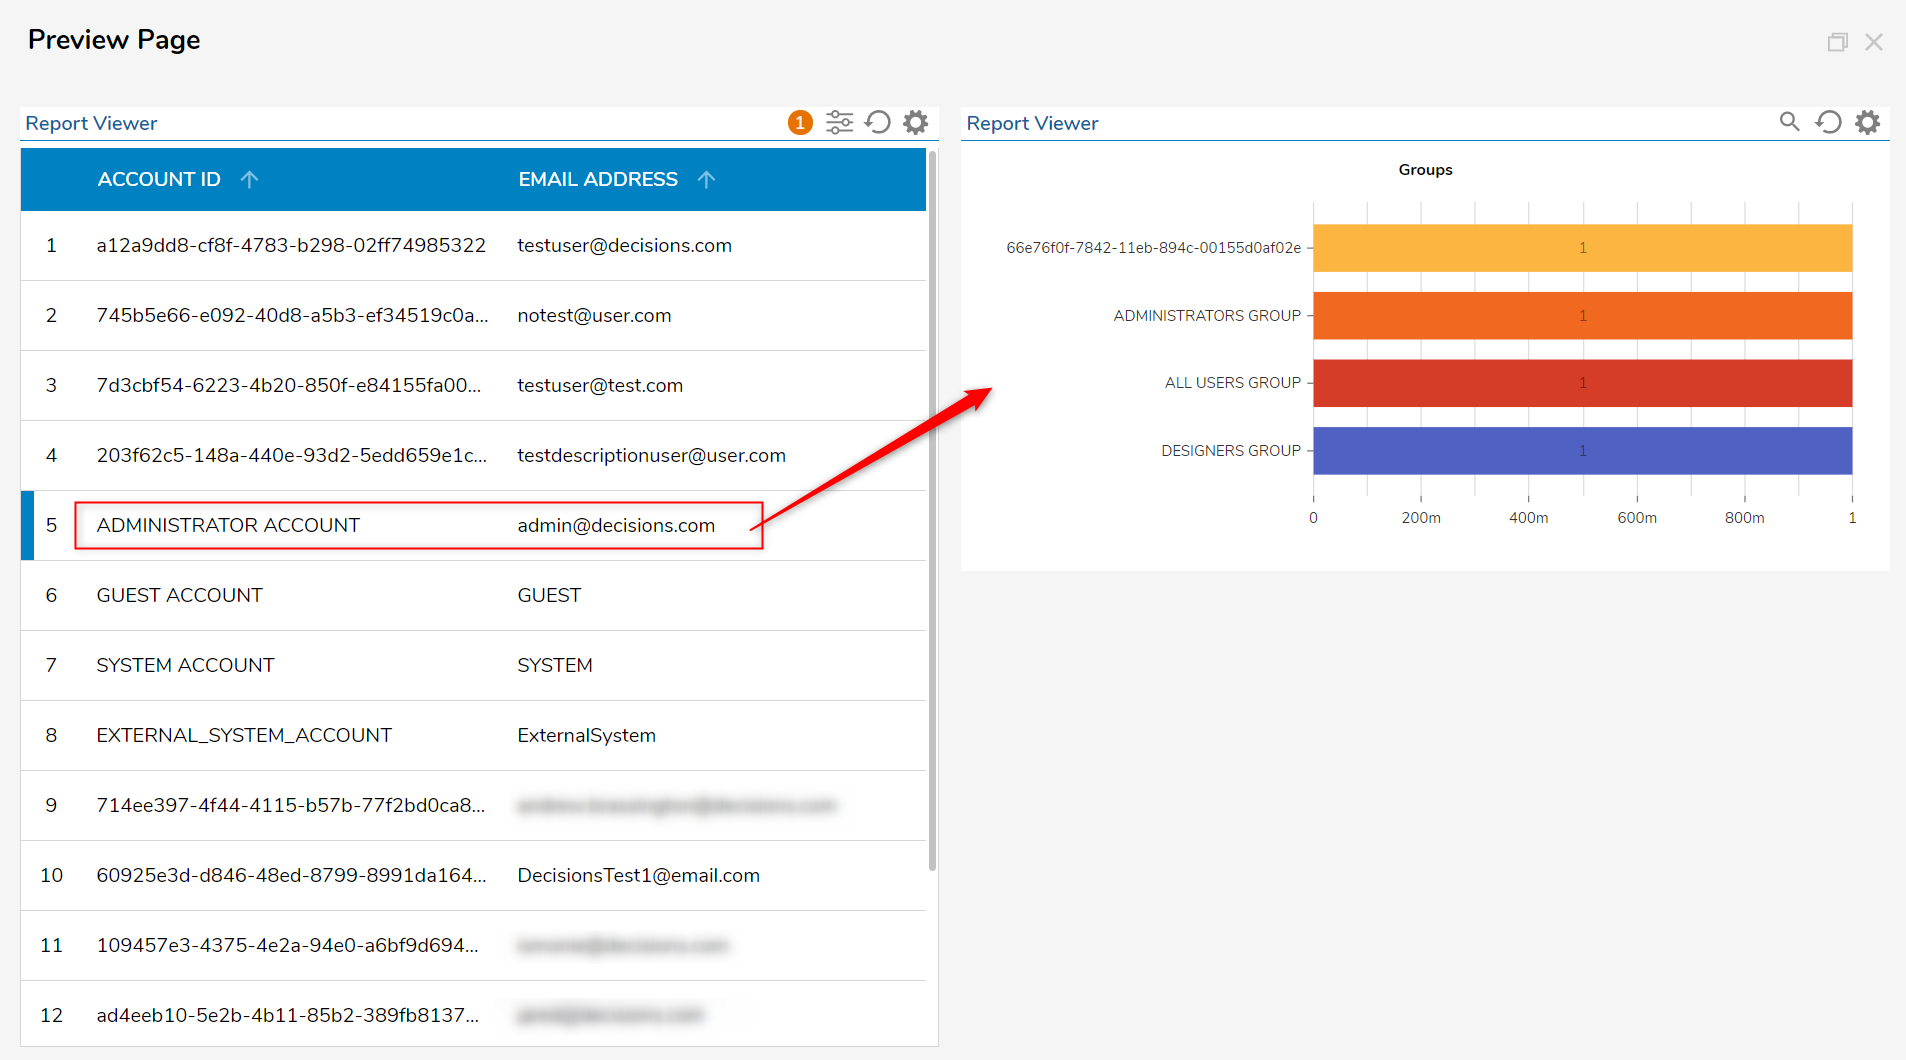
A Page with multiple Reports can be configured to send data based on the row selection of a Parent Report as a filter to a child Report. This means that if the user selects a line item on the Parent Report, specified data reflecting the line item will show in the Child Report; both Reports must be configured to send/receive this filter. This example requires familiarity with creating a Page/Dashboard and configuring a Report, please visit the Create a Page and Dashboard or Create a Report article for more information.
As a prerequisite, this example builds from the example Reports created in the Child Report Values Dependent on Parent Report Row Selection article.
Example
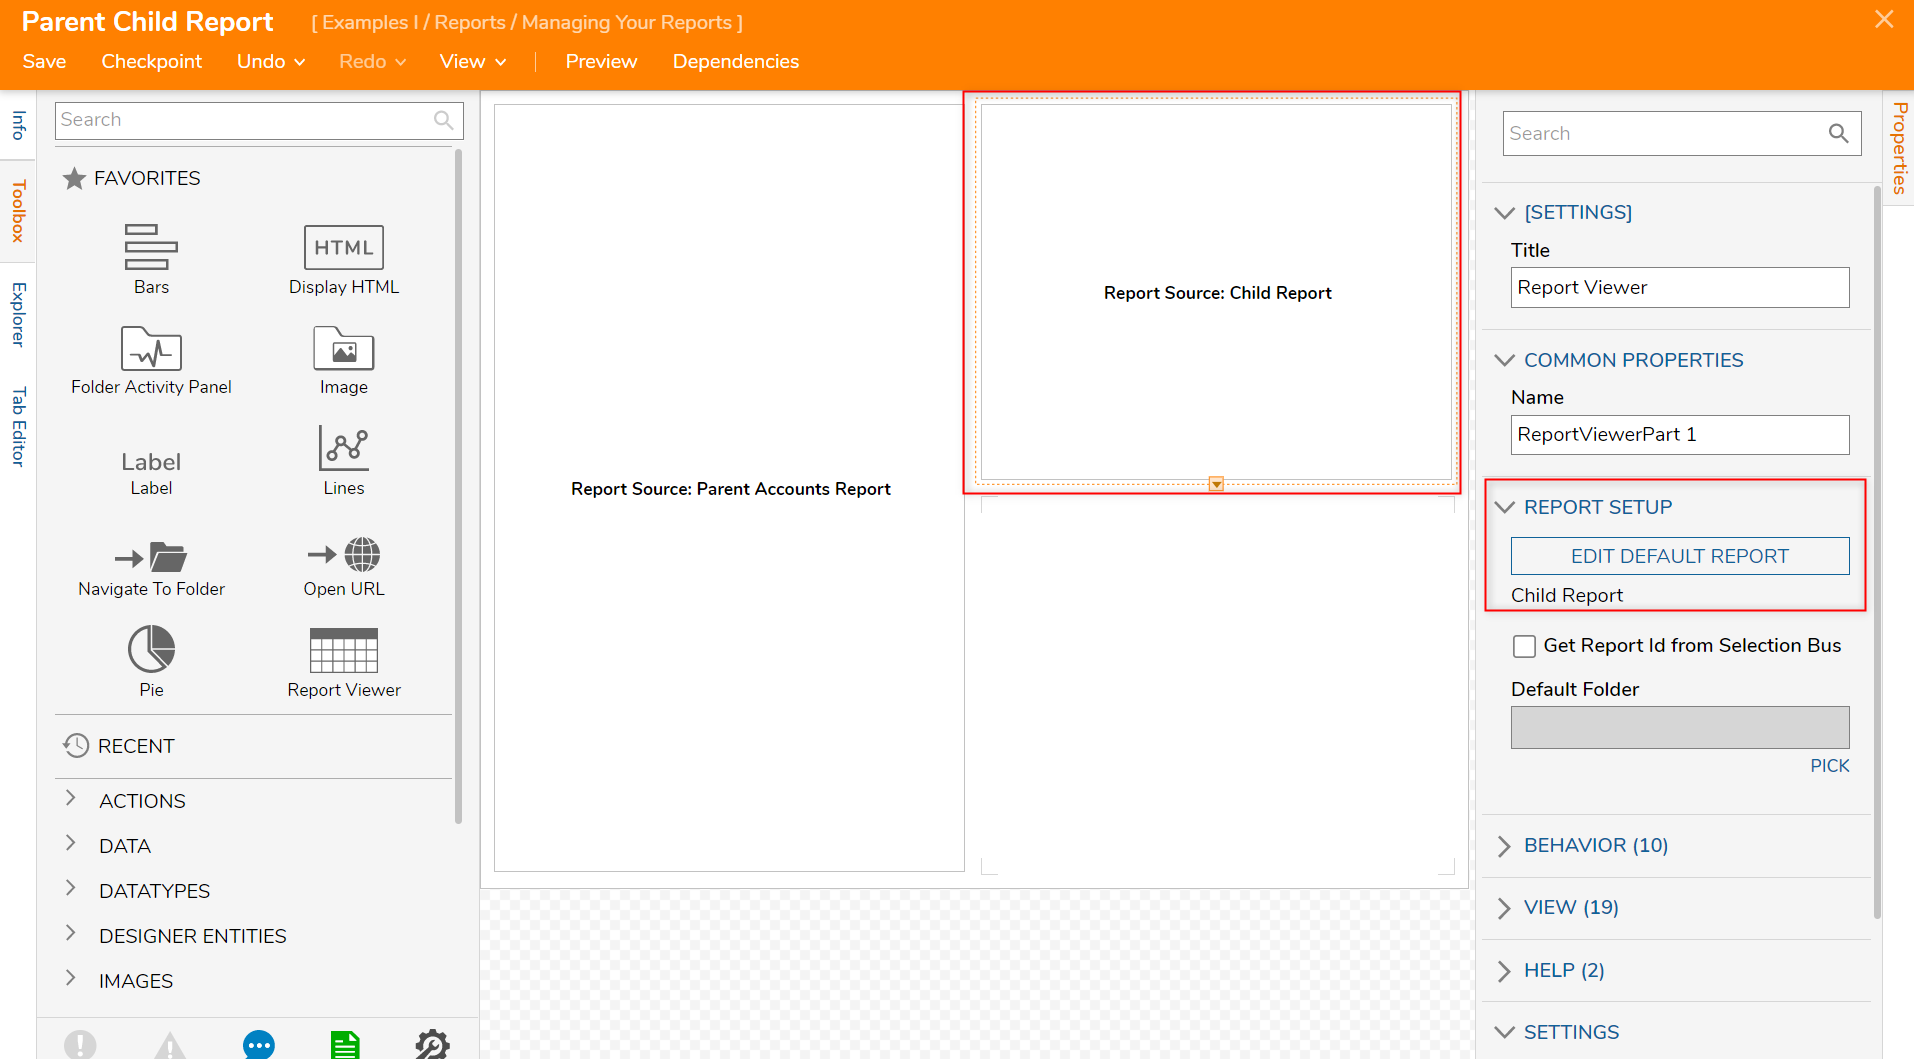
- To begin, navigate to the Parent-Child Report Page and select the Report Viewer that houses the Child Report.
- In the Properties panel navigate to REPORT SETUP and select EDIT DEFAULT REPORT.
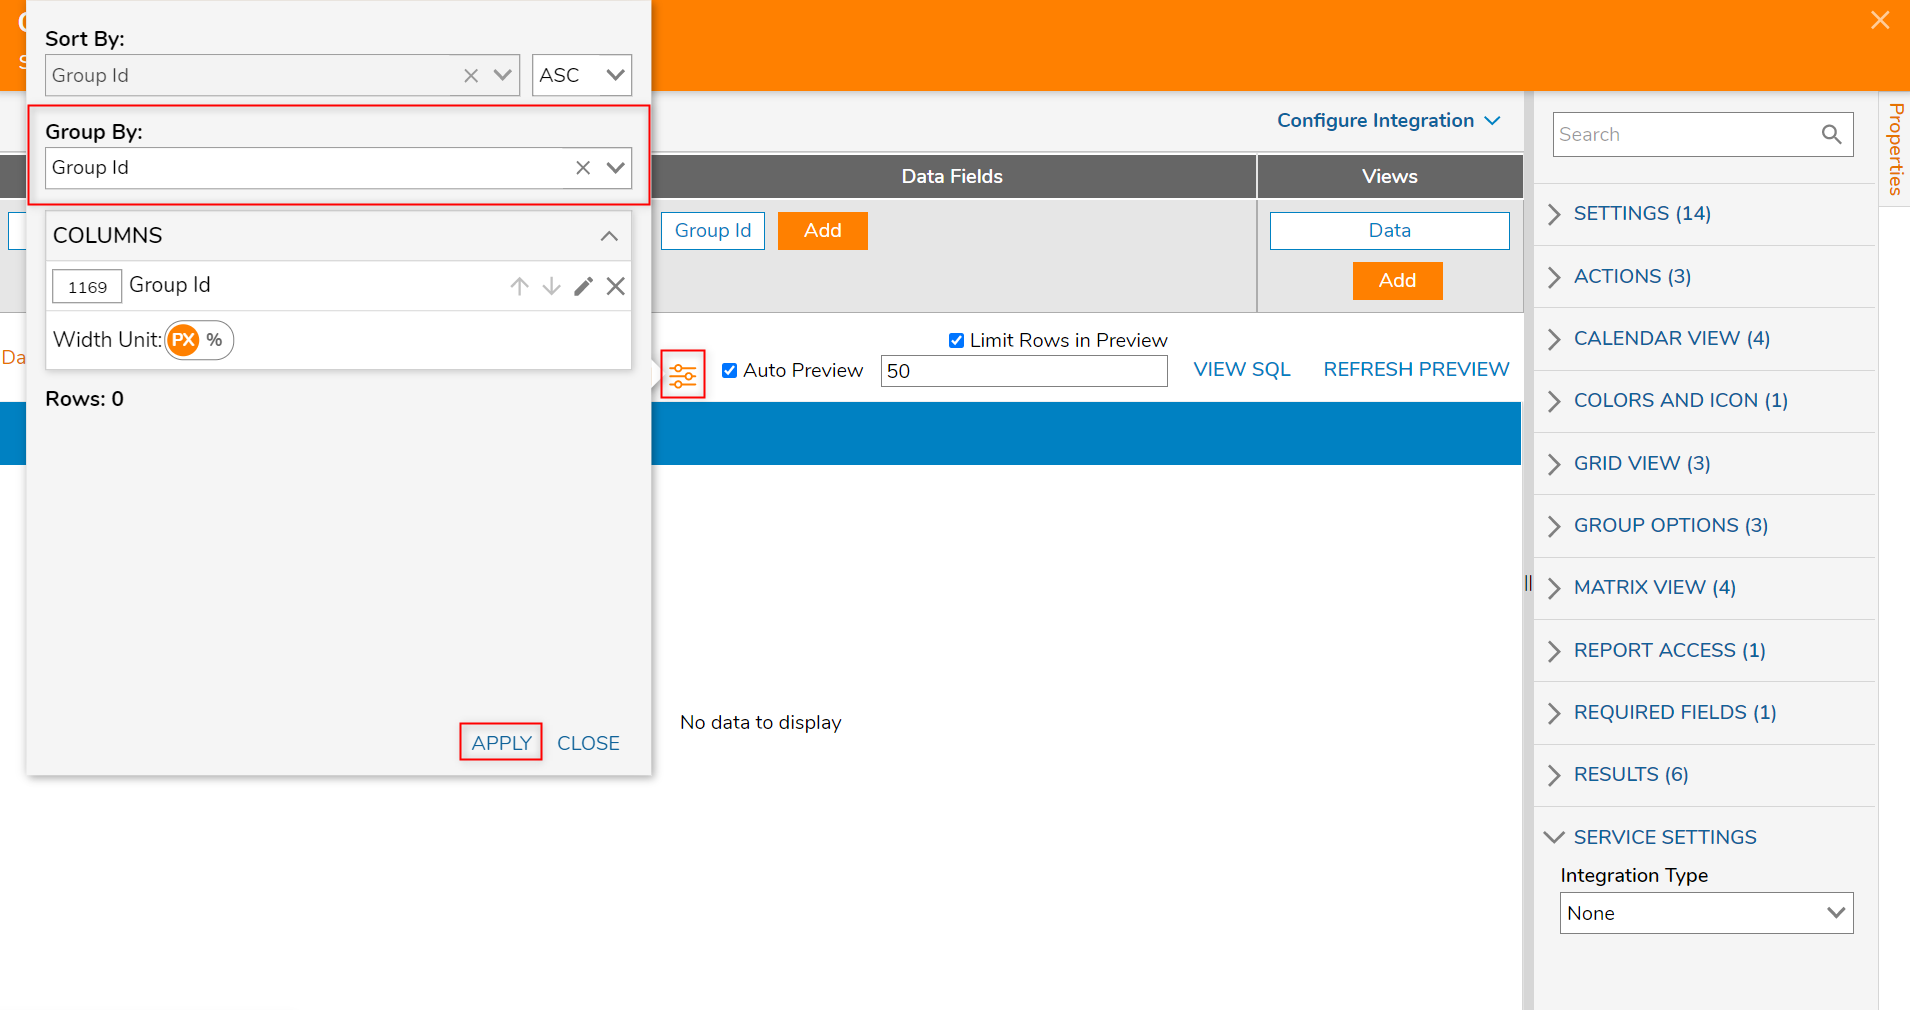
- In the Report Designer, select the abacus or settings icon.
- In the window, locate Group By: and select the Group Id. Click APPLY.
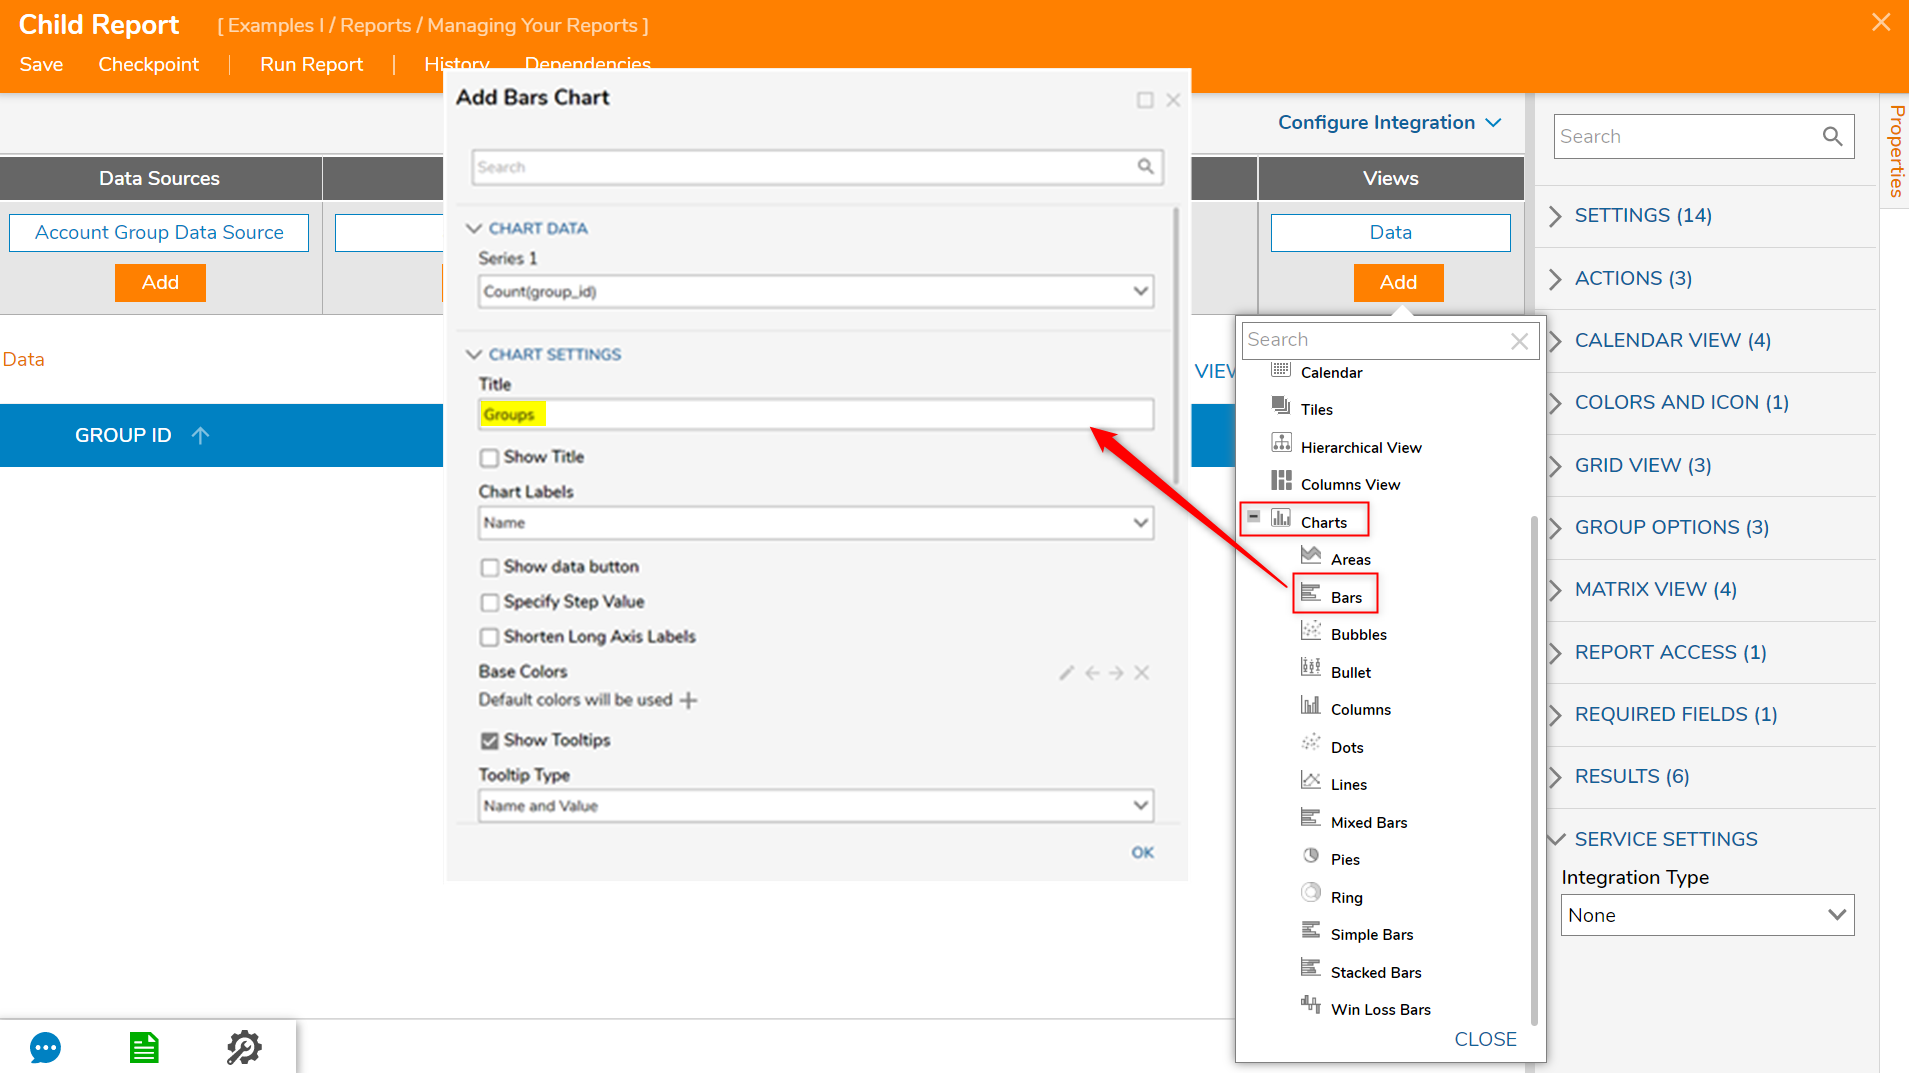
- Next, click Add under Views.
- In the Charts section, select Bars.
- In the Add Bars Chart window, name the Bar Chart [Groups].
- Save and Close the Report and Page Designers.
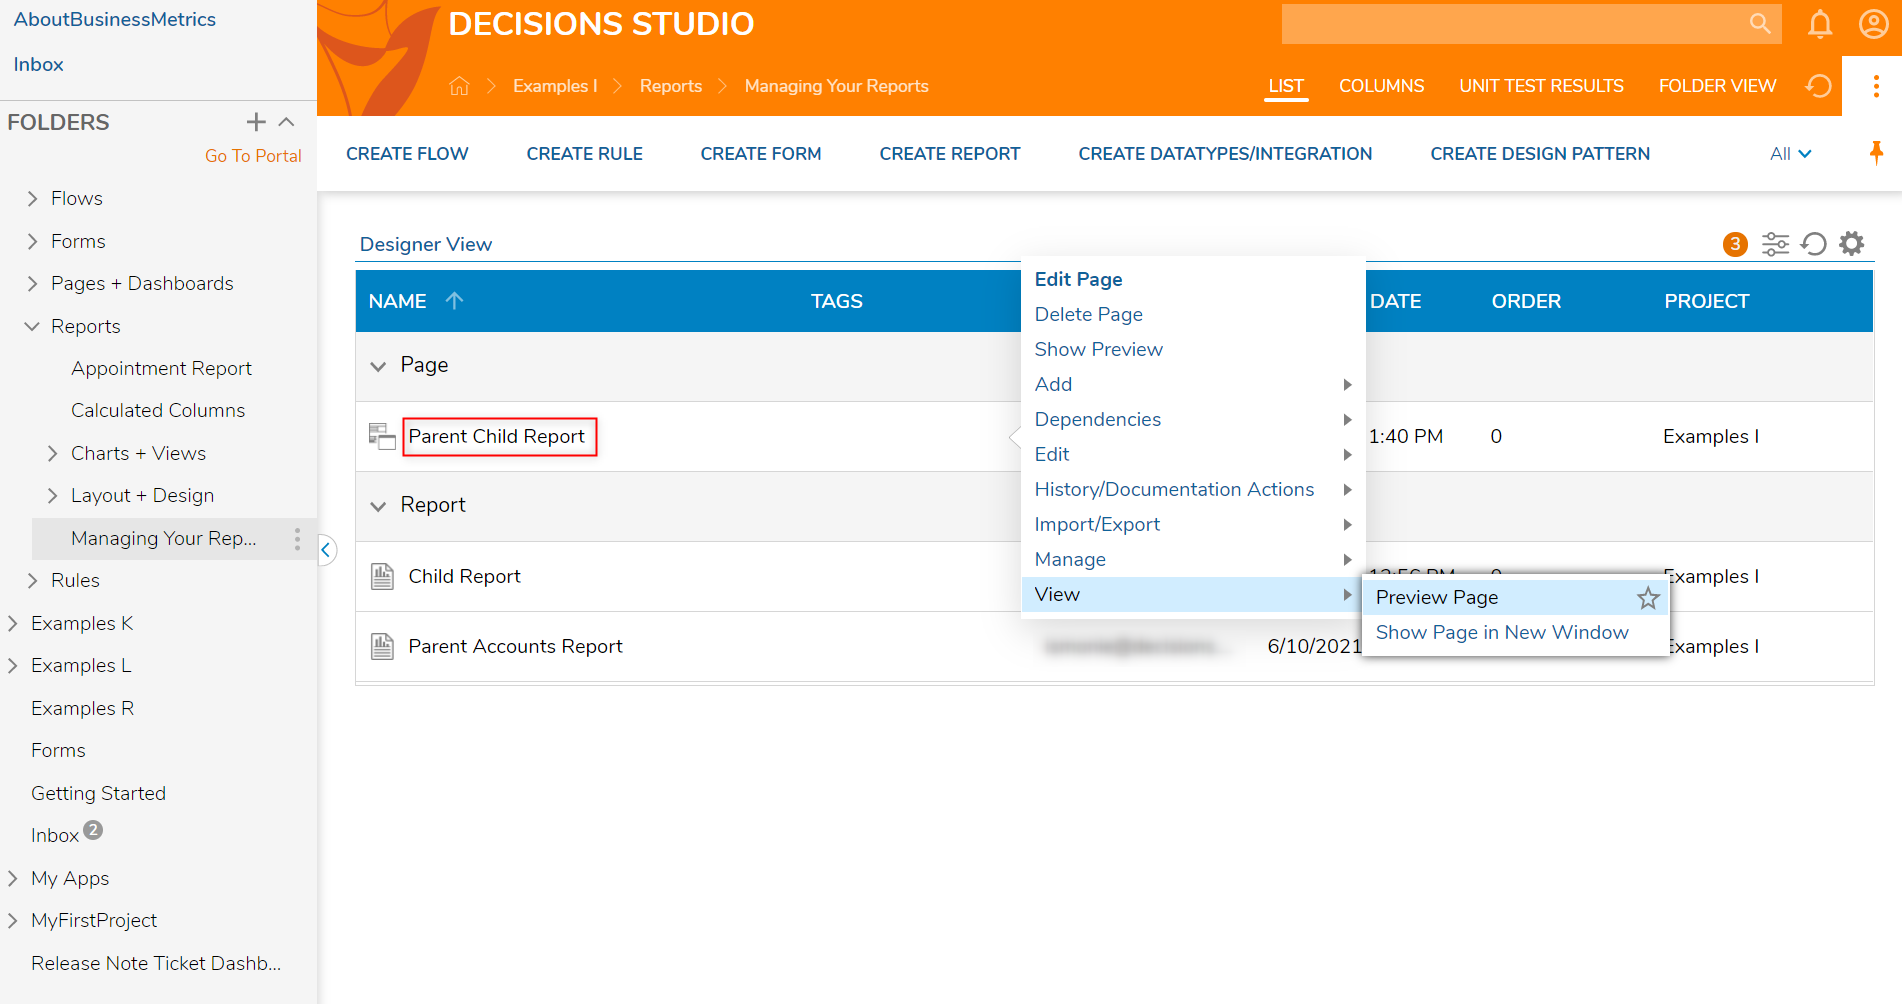
- Next, back in the Designer Folder, right-click on the Parent-Child Report Page, and locate View > Preview Page.
- On the Preview Page, locate the gear or settings icon on the Child Report and change the View from Data to Bars.
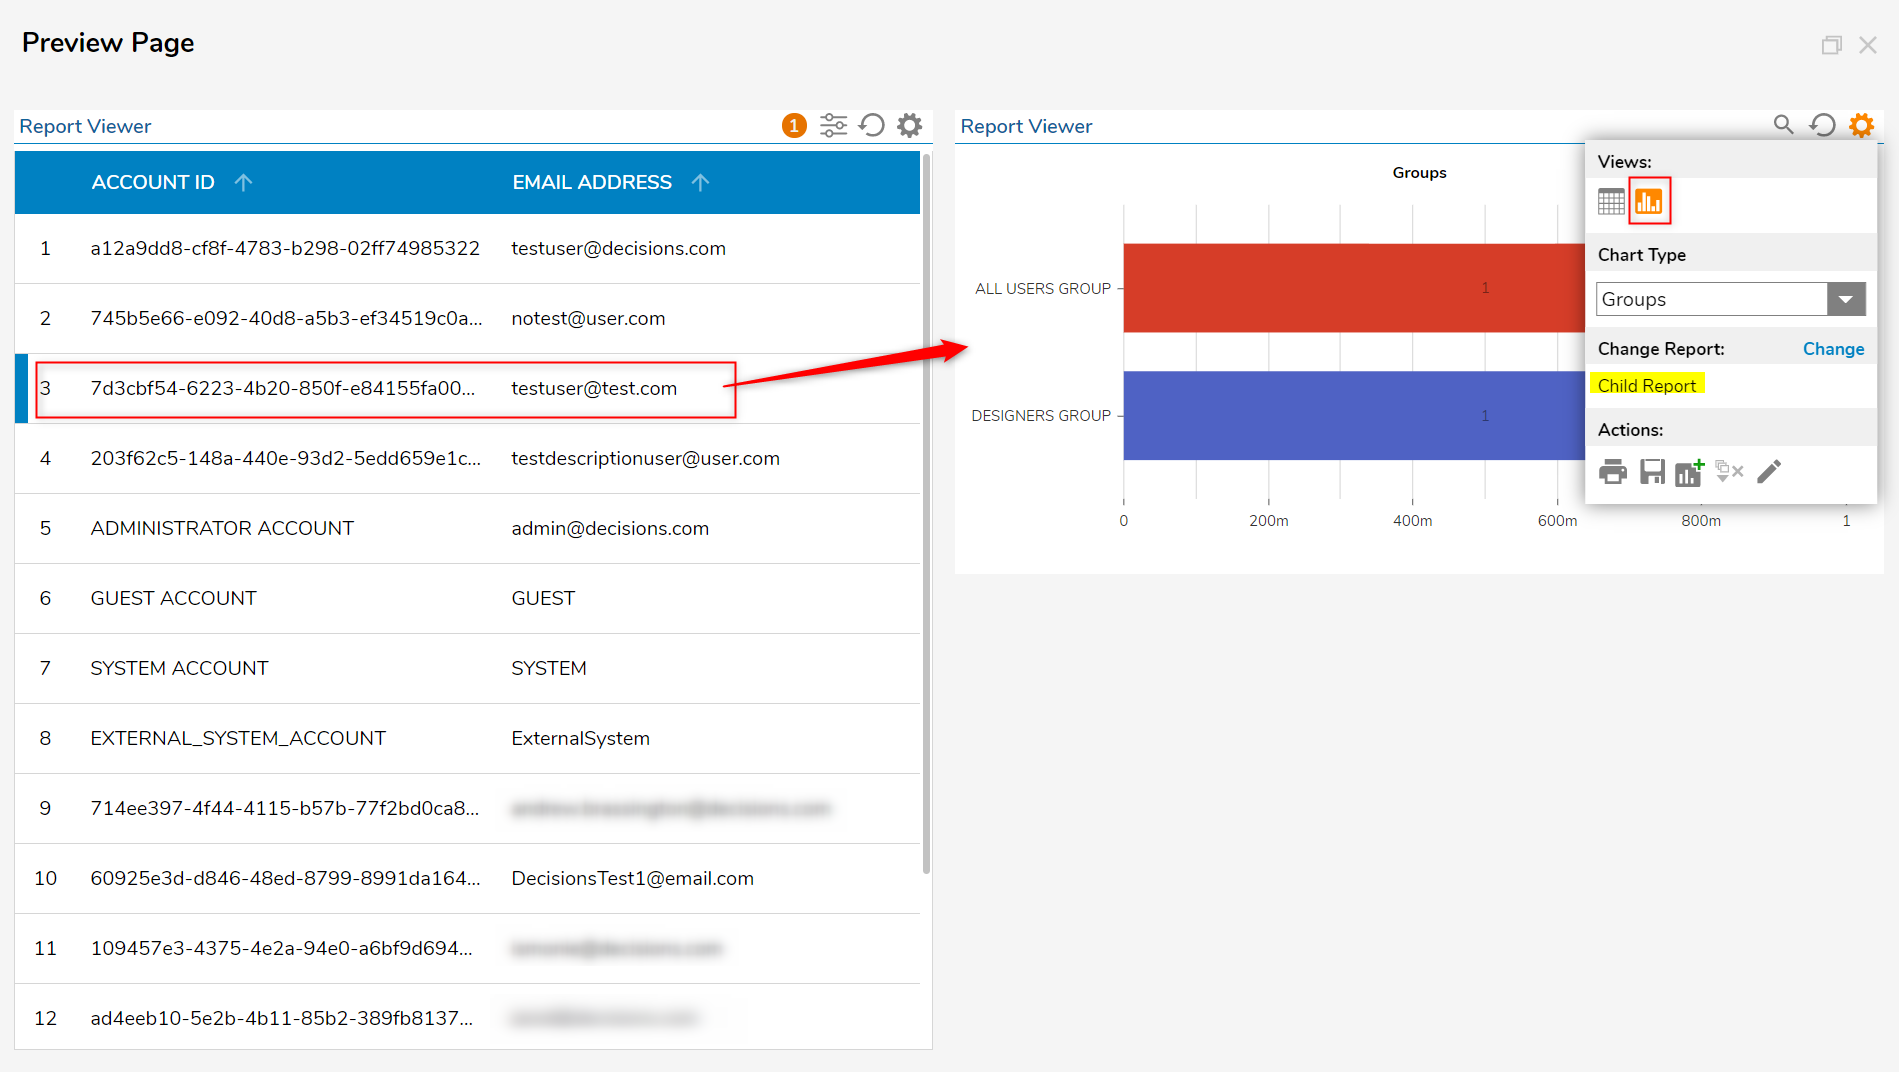
- Lastly, click on different accounts and notice the Bar Chart filtering Report data.
