Overview
In a Report, the Conditional Formatting feature changes the color of a row or column based on a specific value. This feature is similar to the Color and Icon Rules; however, it is only supported with String, Int32, Decimal, and Boolean data types.
Conditional Formatting is lightweight compared to Color/Icon Rule, as it runs on the client side, whereas Rules run on the server side, which is a heavier operation on the Report.
Additionally, if both the Conditional Formatting and a Color/Icon Rule were used simultaneously, they would behave identically if the outputs were defined the same.
Example
Performance Tip:
Conditional Formatting is designed to be a high-performance method for styling reports with simple highlighting rules. Because all formatting is handled on the client side, it avoids server-side processing, which can be resource-intensive. This makes it especially effective for high-traffic dashboards or reports that contain large volumes of data and require fast, responsive rendering across many users.
- In a Designer Project, select CREATE REPORT from the Global Action Bar.
- Select and name the default Report in the resulting window, then click CREATE to enter the Report Designer.
- In the Report Designer, click Add under Data Source. Then, expand Common and select Account Data Source.
- Next, add Email Address, Department, and Created on Date under Data Fields.
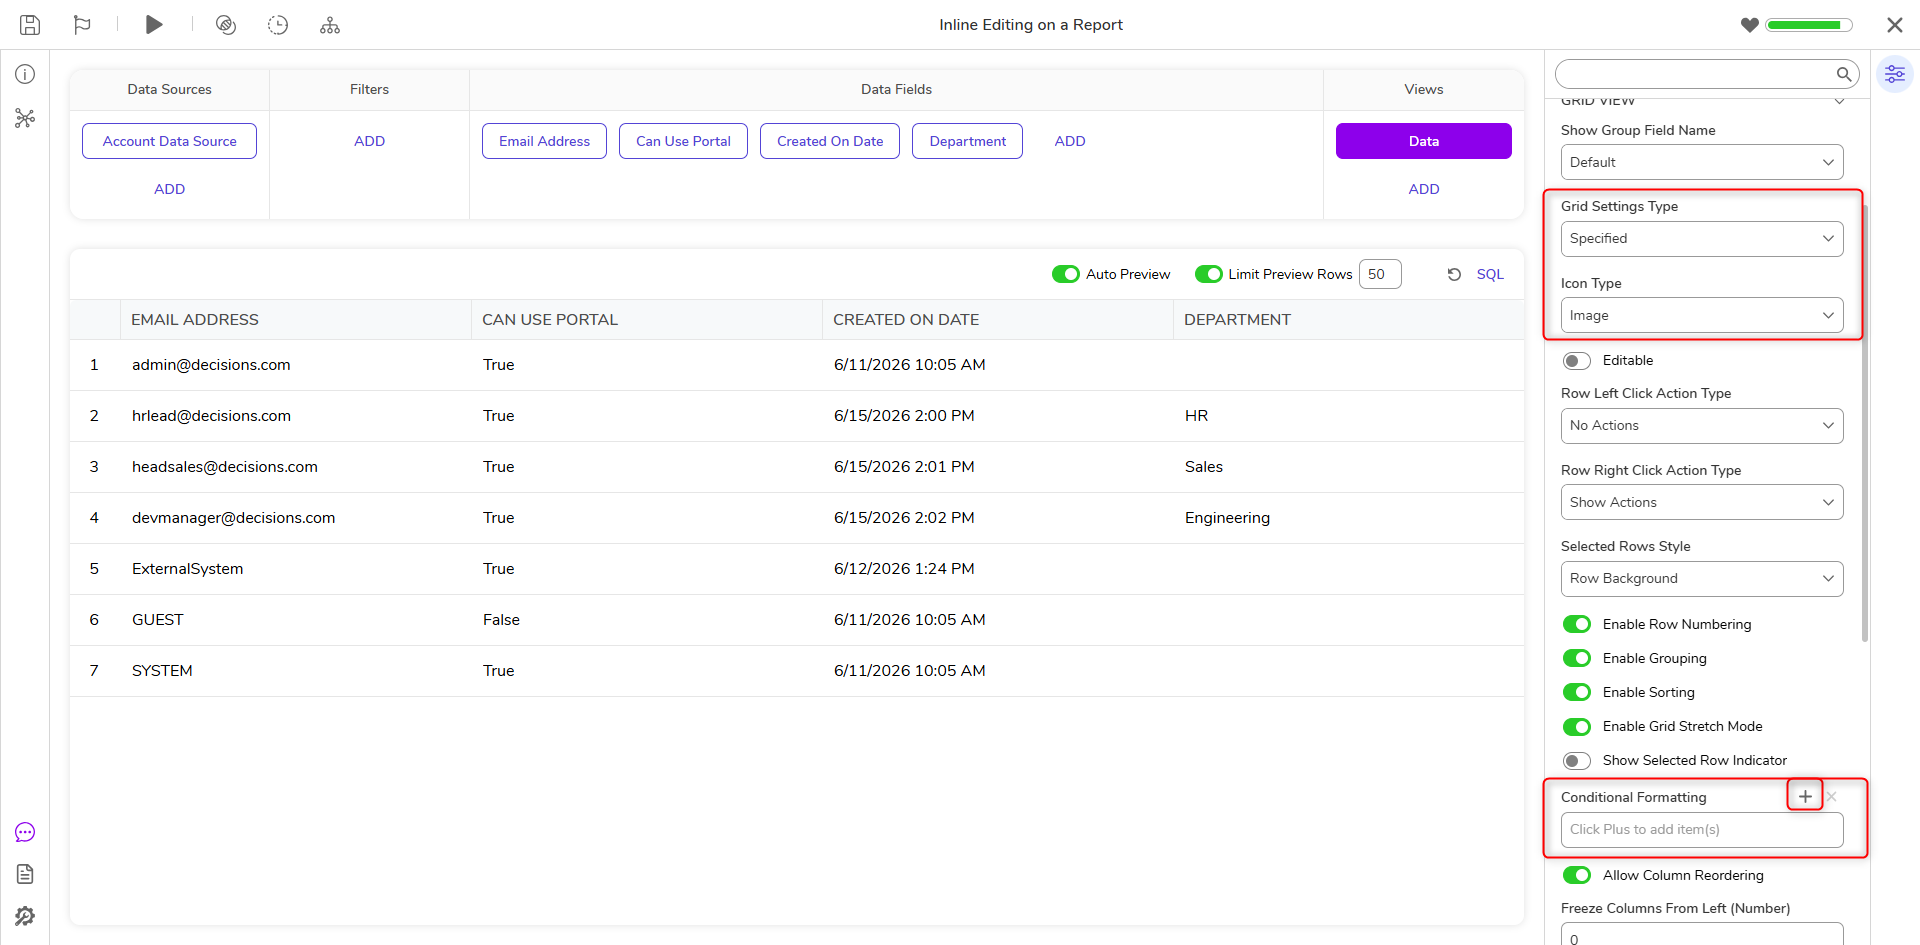
- Navigate to Properties > GRID VIEW, change Grid Settings Type to Specified, and change Icon Type to Image.
- Under Properties > GRID VIEW > Conditional Formatting, select ADD.
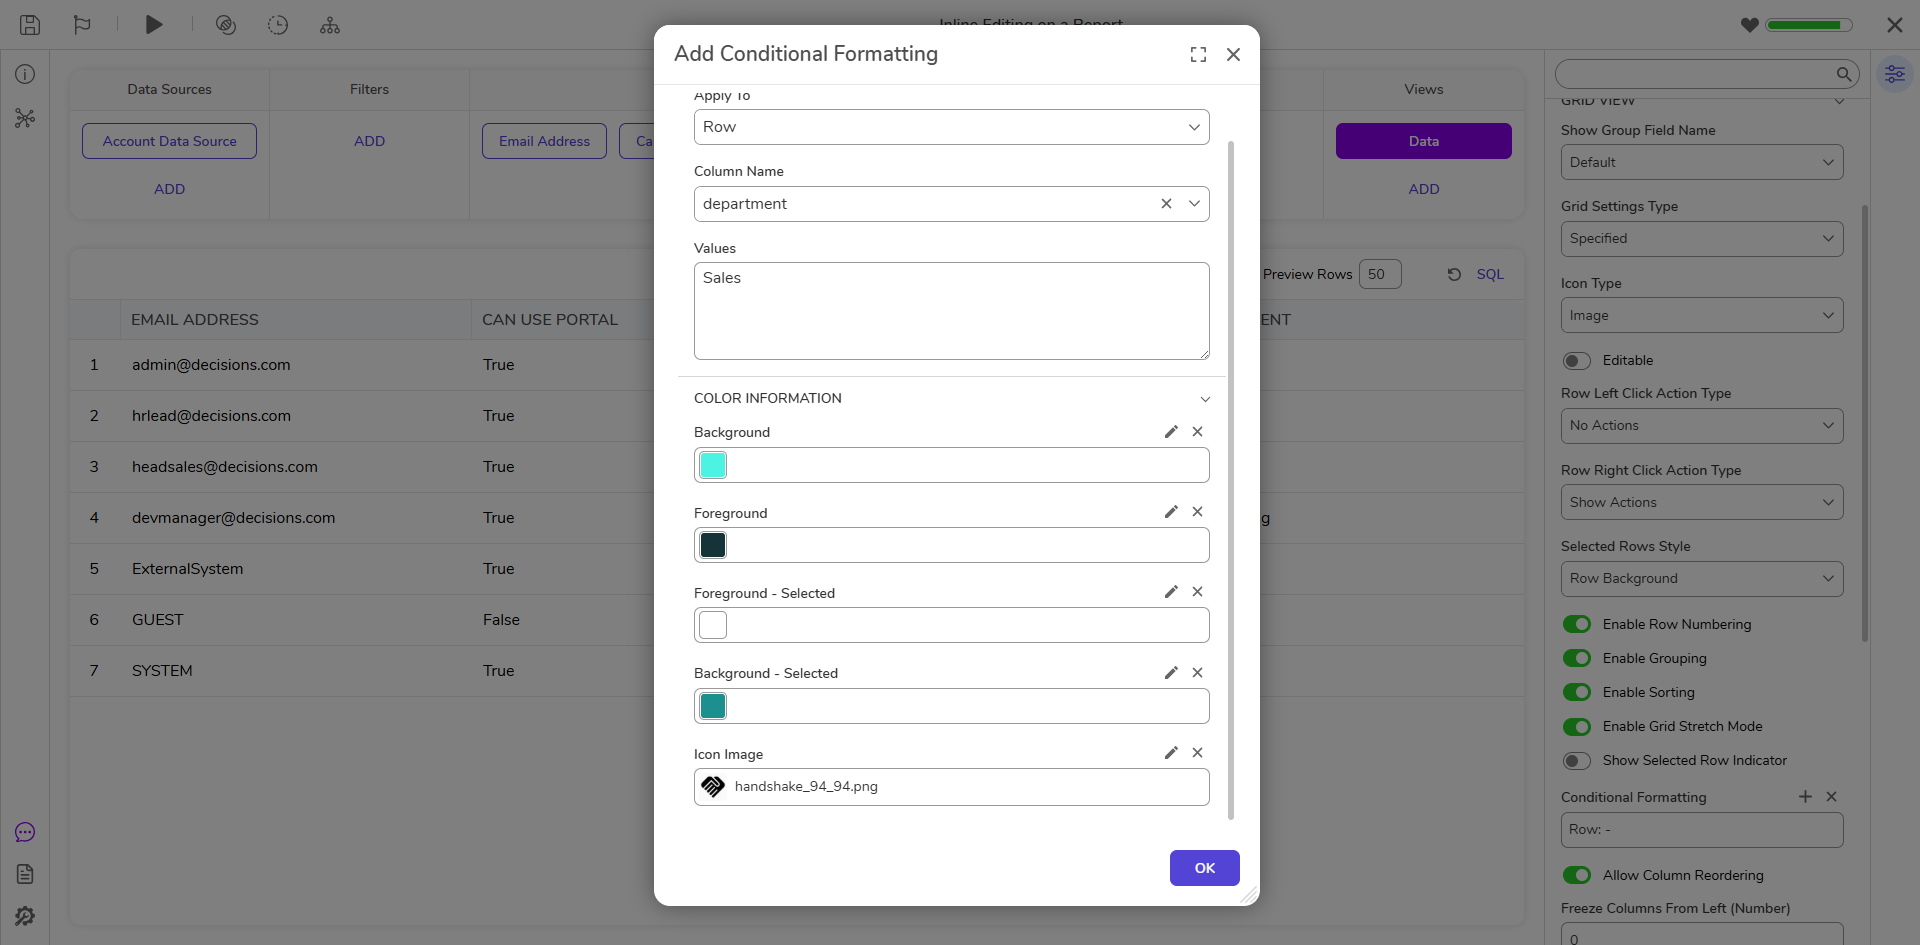
- Choose Row or Column under FORMATTING > Apply To in the resulting window.
- Next, select the department from the FORMATTING > Column Name drop-down list.
- In the Values field, add a specific value.
- Set Background and Foreground colors to highlight the specified accounts. The Background is the Row color, and the Foreground is the Text color.
- Choose an Icon Image, if desired. Then, select OK.
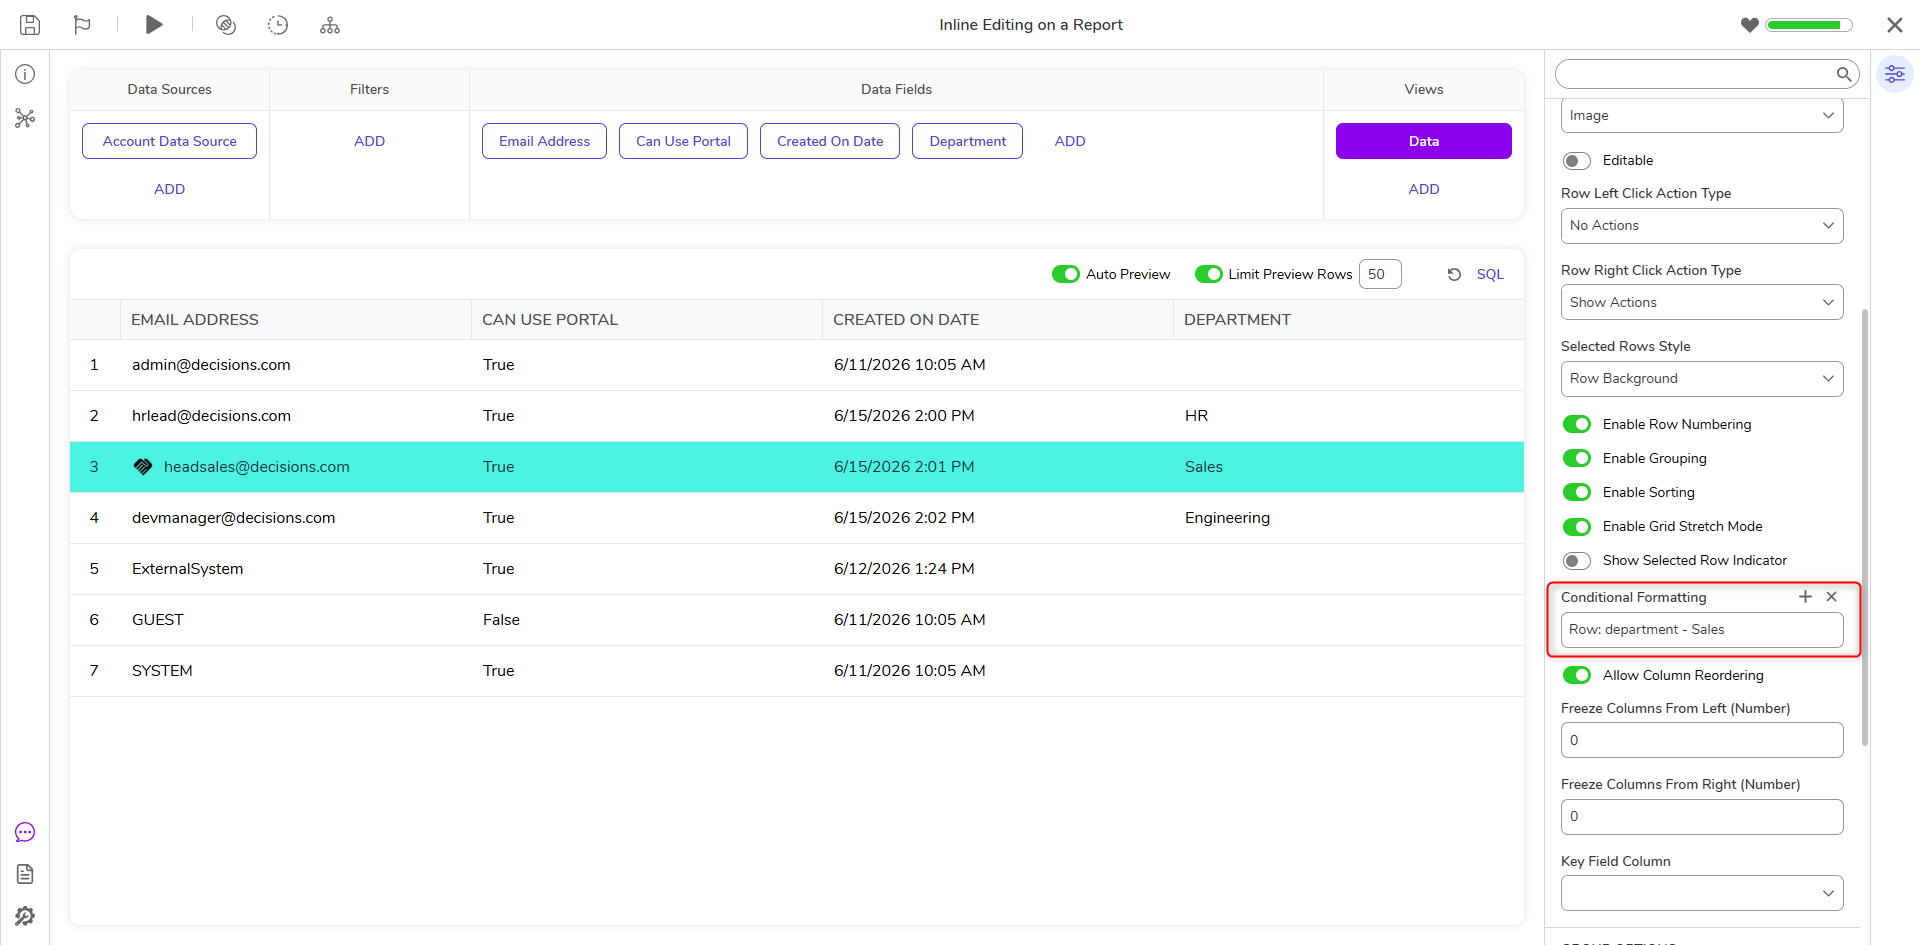
- In the Report Designer, click REFRESH PREVIEW to see the updated highlighted Row or Column. Additionally, the highlights will also appear when clicking Run Report.
Feature Changes
| Description | Version | Developer Task |
|---|---|---|
| Added the ability to format the Number Types (Int32 and Decimal) in Conditional Formatting | 9.8 | [DT-042006] |