Simulating Process Changes
- 05 Dec 2023
- 2 Minutes to read
- Print
- DarkLight
Simulating Process Changes
- Updated on 05 Dec 2023
- 2 Minutes to read
- Print
- DarkLight
Article summary
Did you find this summary helpful?
Thank you for your feedback
Overview
Before committing to a potentially lengthy and/or involved changed in a process, users may simulate changes to the Process Map by viewing the event log's BPMN model.
Navigating to the Simulation
There are two pages that offer simulation settings: the Analyzer and the Modeler.
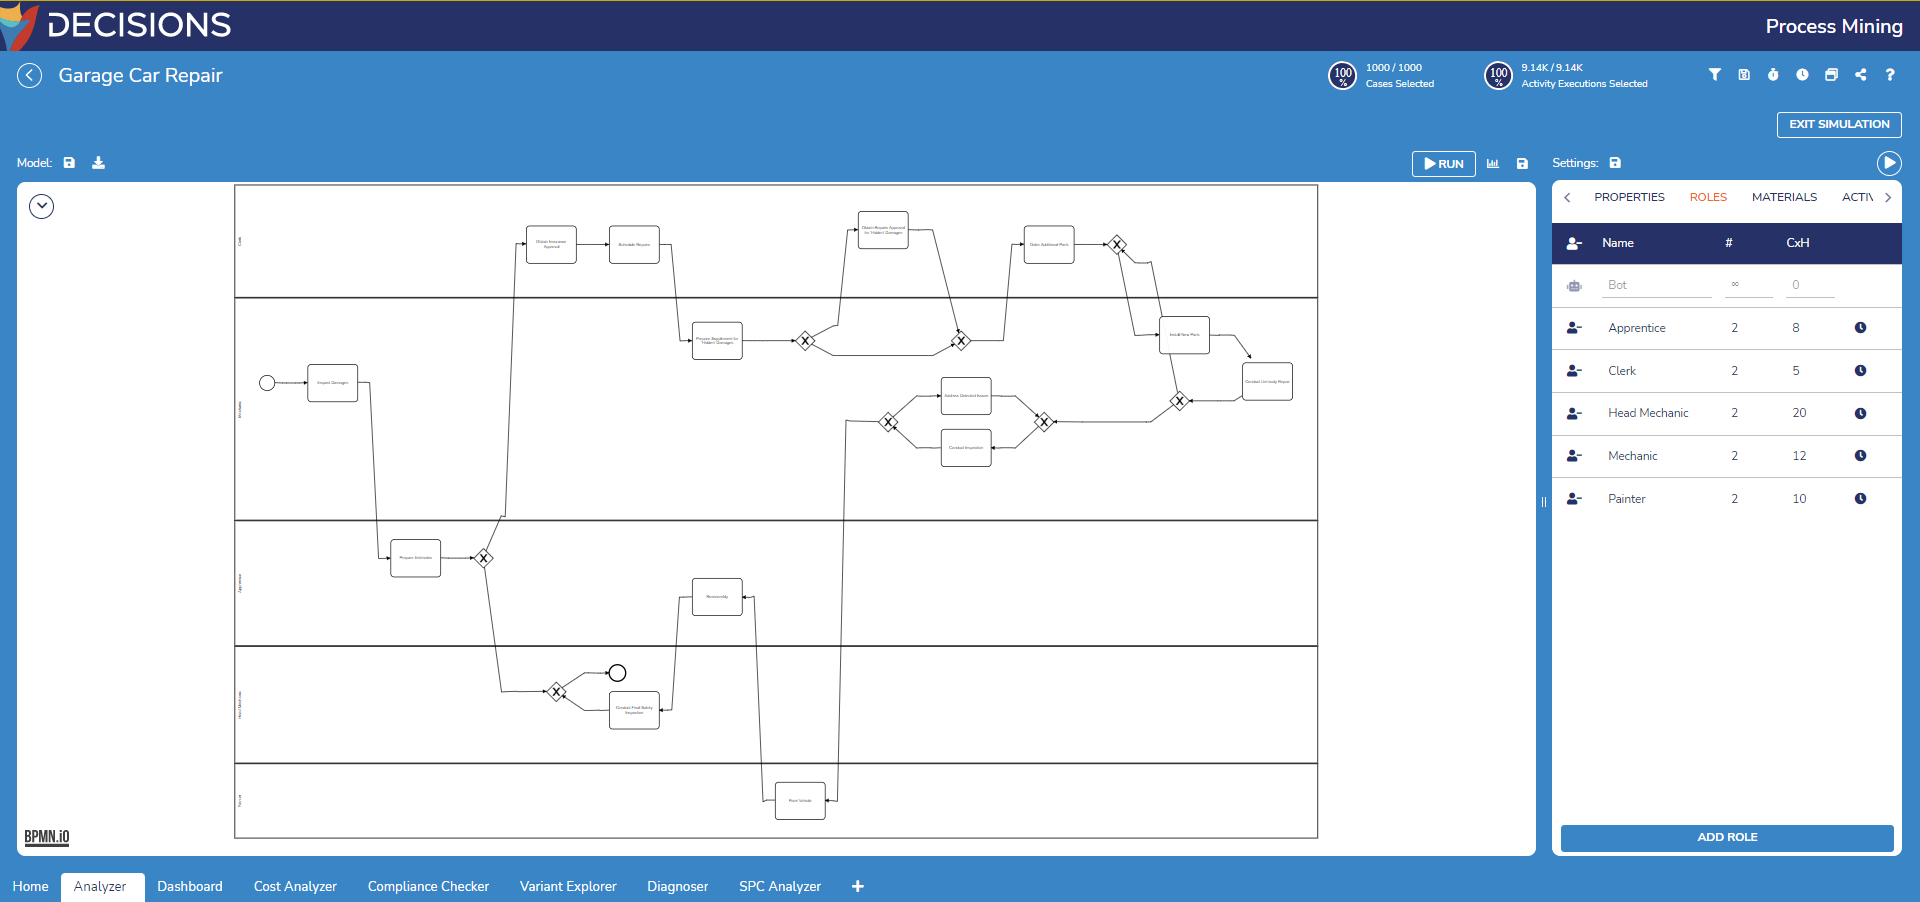
- From the Analyzer tab of an event log, enable the BPMN Model View then navigate to Run > Process Simulation in the top left diagram menu. This opens the Analyzer's simulation settings that mirror the look of the Modeler.Roles in the SimulationIn addition to enabling the BPMN Model View, it is recommended to also enable Include Lanes to automatically populate the Modeler with Roles. Else, these must be manually entered similar to directly opening the Modeler.
- From the Process Mining Home tab, open any BPMN model to automatically open the Modeler.
.gif)

.gif)
Simulation Settings
| Setting Location | Setting Name | Default Value | Function |
|---|---|---|---|
| Properties | Number of Instances | 100 | Prompts for number of iterations the simulation will run |
| Distribution | Exponential | Allows selection of how distribution is visualized between the following options: Exponential, Normal, Uniform, and Fixed. | |
| Once Every | [Data Dependent] | Runs each instance in the simulation with this artificial time in between | |
| Start Date | [Time Modeler Opened] | Prompts for the start date of the simulation | |
| Enable Case Management | False | Toggles whether all activities within a case requiring the same role will be performed by the same resource | |
| Select Average over Multiple Runs | True | Toggles selection of the simulation with the most average performance across multiples simulations | |
| Currencies | AUD | Allows selection of currency type to display. | |
| Set Work Schedule (also shown as clock icon in Roles) | -- | Prompts users to enable then apply a work schedule onto the simulation to account for in its instances. | |
| Roles | Name | [Data Dependent] | Prompts for name of the Role within the simulation e.g. job titles |
| Quantity | [Data Dependent] | Prompts for number of resources belonging to the Role within the simulation | |
| Cost per Hour | 0 | Prompts for cost of the Role per hour | |
| Add Role | -- | Creates a new Role in the Roles Table | |
| Remove Role (person icon) | -- | Remove the selected Role from the Roles Table | |
| Materials | Name | [Data Dependent] | Prompts for name of the Material within the simulation |
| Quantity | 1 | Prompts for number of Material within the simulation | |
| Delivery Rate | -- | Opens the Delivery Rate dialog where users define the distribution of the Material as well as its frequency | |
| Delivery Quantity | -- | Opens the Delivery Quantity dialog where users define the distribution of the Material as well as view its mean value | |
| Add Material | -- | Adds a Material found in the process to the simulation | |
| Remove Material (minus icon) | -- | Remove the selected Material from the simulation. | |
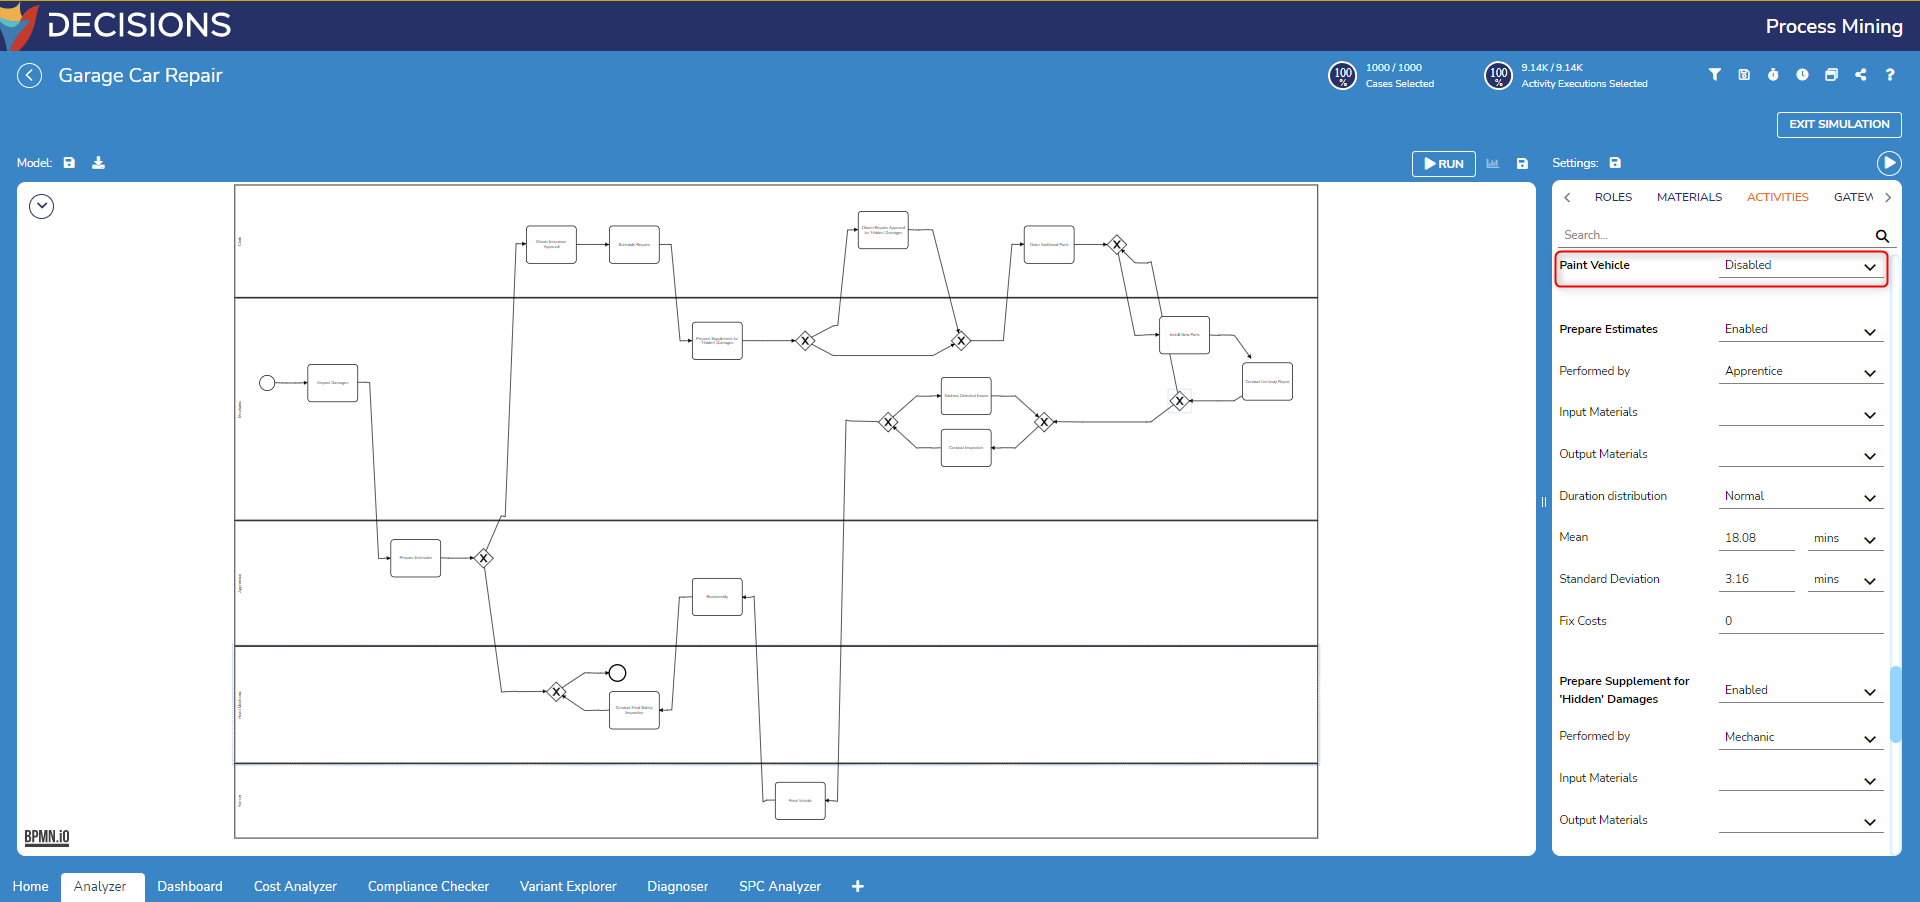
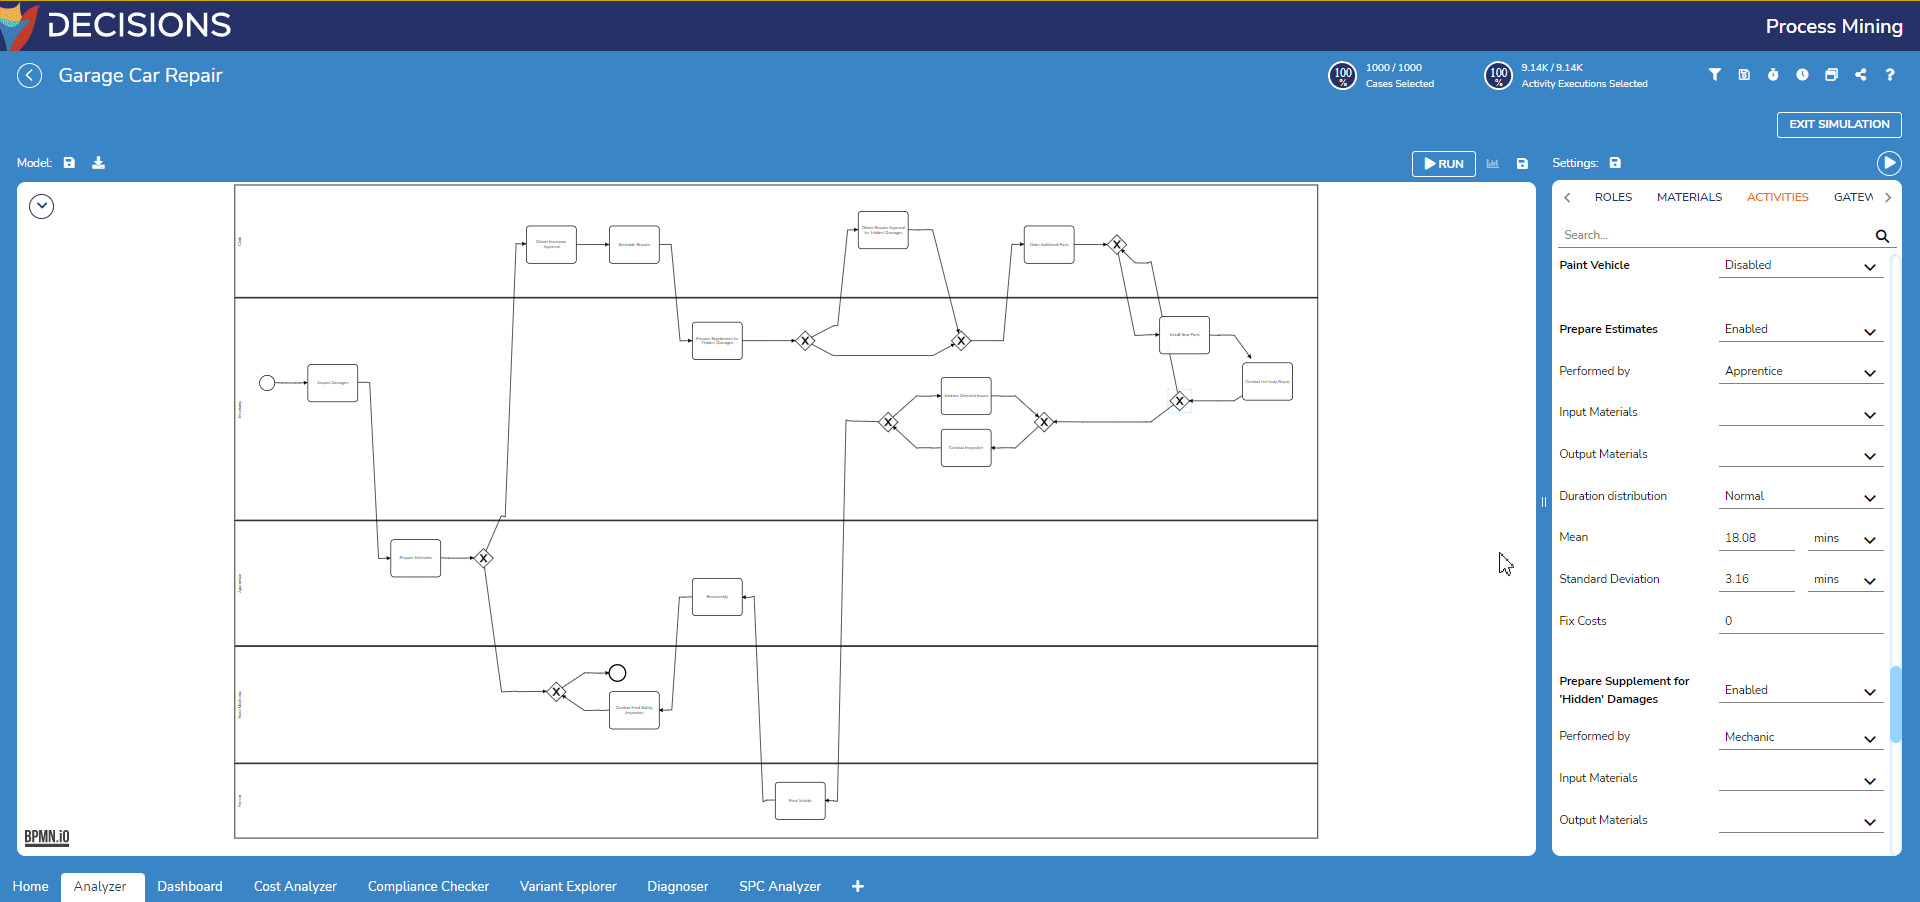
| Activities | [Activity Name and Info] | -- | Automatically populates with Activities within the process that users may individually choose to enable/disable in the simulation. Each activity contains settings such as which role performs it, its input and output materials, its distribution, mean, etc. |
| Gateways | [Gateway Split Names] | -- | Automatically populates with Gateways detailing where a process splits in the process. Each split lists its branches and a percentage of how many cases took that branch. |
Simulating from the Analyzer
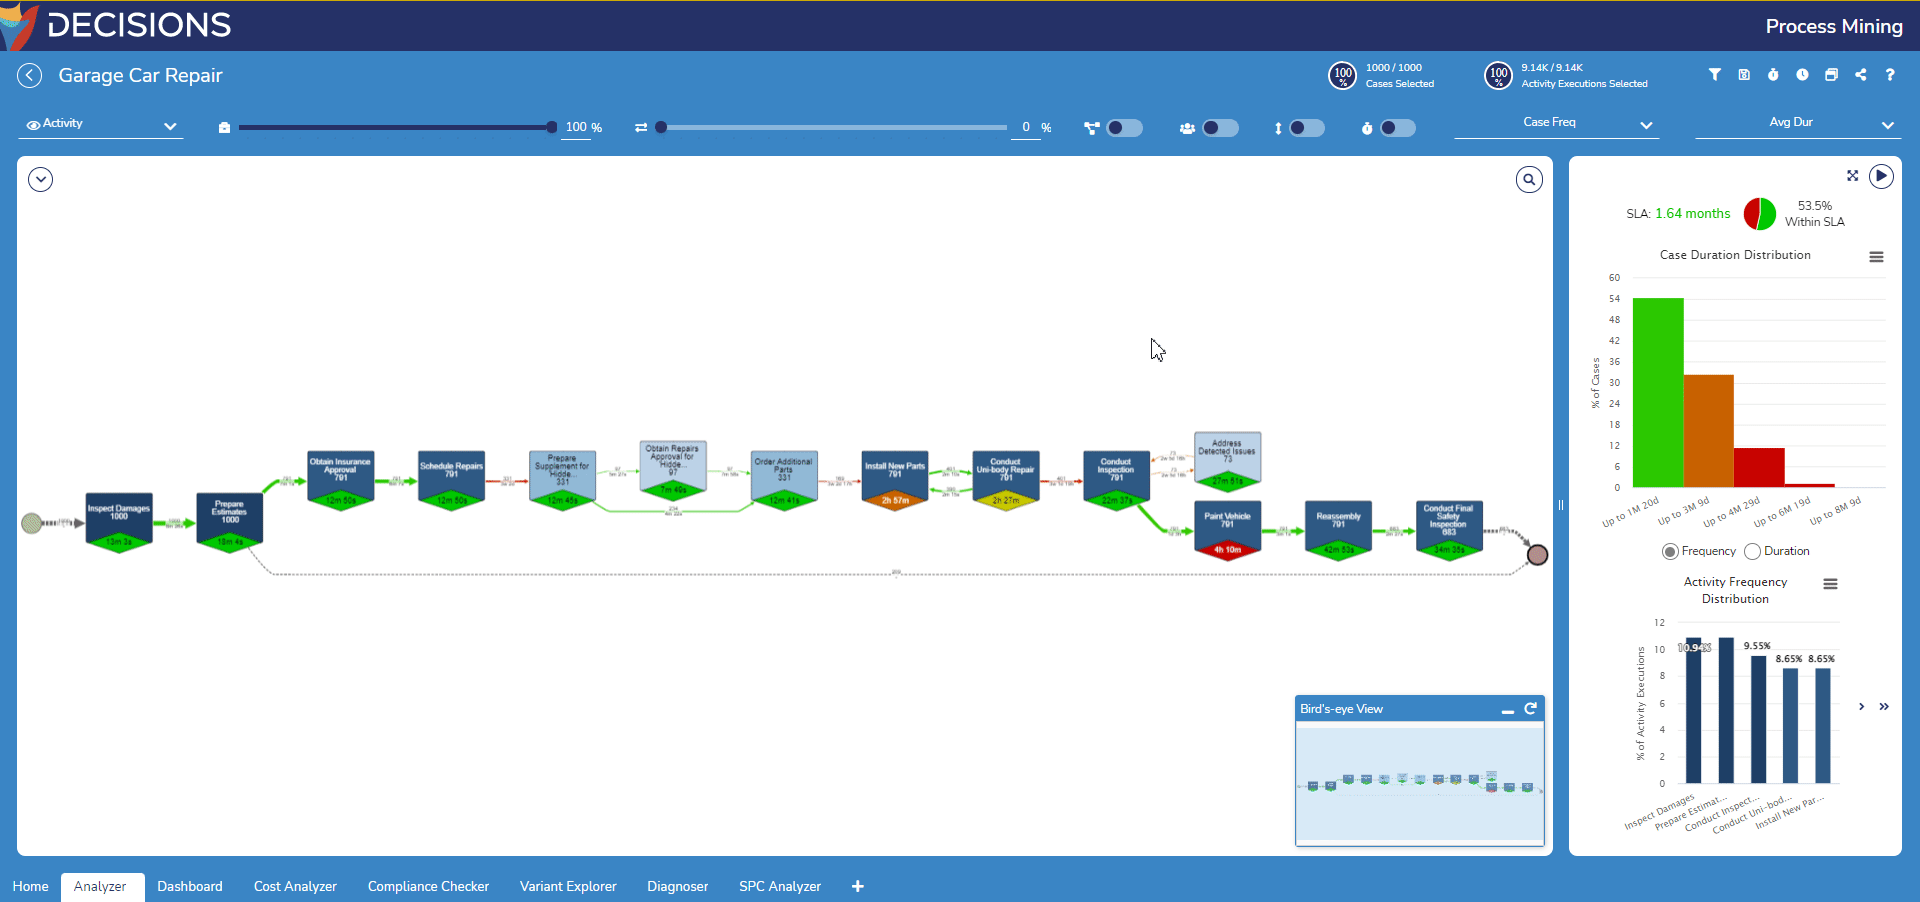
- Open an event log in the Home page and navigate to the Modeler via the Analyzer page as described above. This example uses the pre-built 'Garage Car Repair' event log.
- In the Analyzer's simulation settings, view the Properties tab. Change the currency to USD.
- Select the Roles tab. Enter values in the Cost per Hour (CxH) column for each Role.
- Select the Activities tab. Find the Paint Vehicle activity and disable it from the simulation's results.
- Select the RUN button above the top right of the diagram. A green popup will appear below it confirming the simulation ran successfully.
- Select the graph icon to the right of the RUN button to view the simulation's results.
- To save the simulation, select the Save Log As button represented as the save icon next to the graph icon. Select a location with Process Mining to save the simulation.
Furthermore, the simulation settings may also be saved by selecting the save icon above the Simulation Settings panel.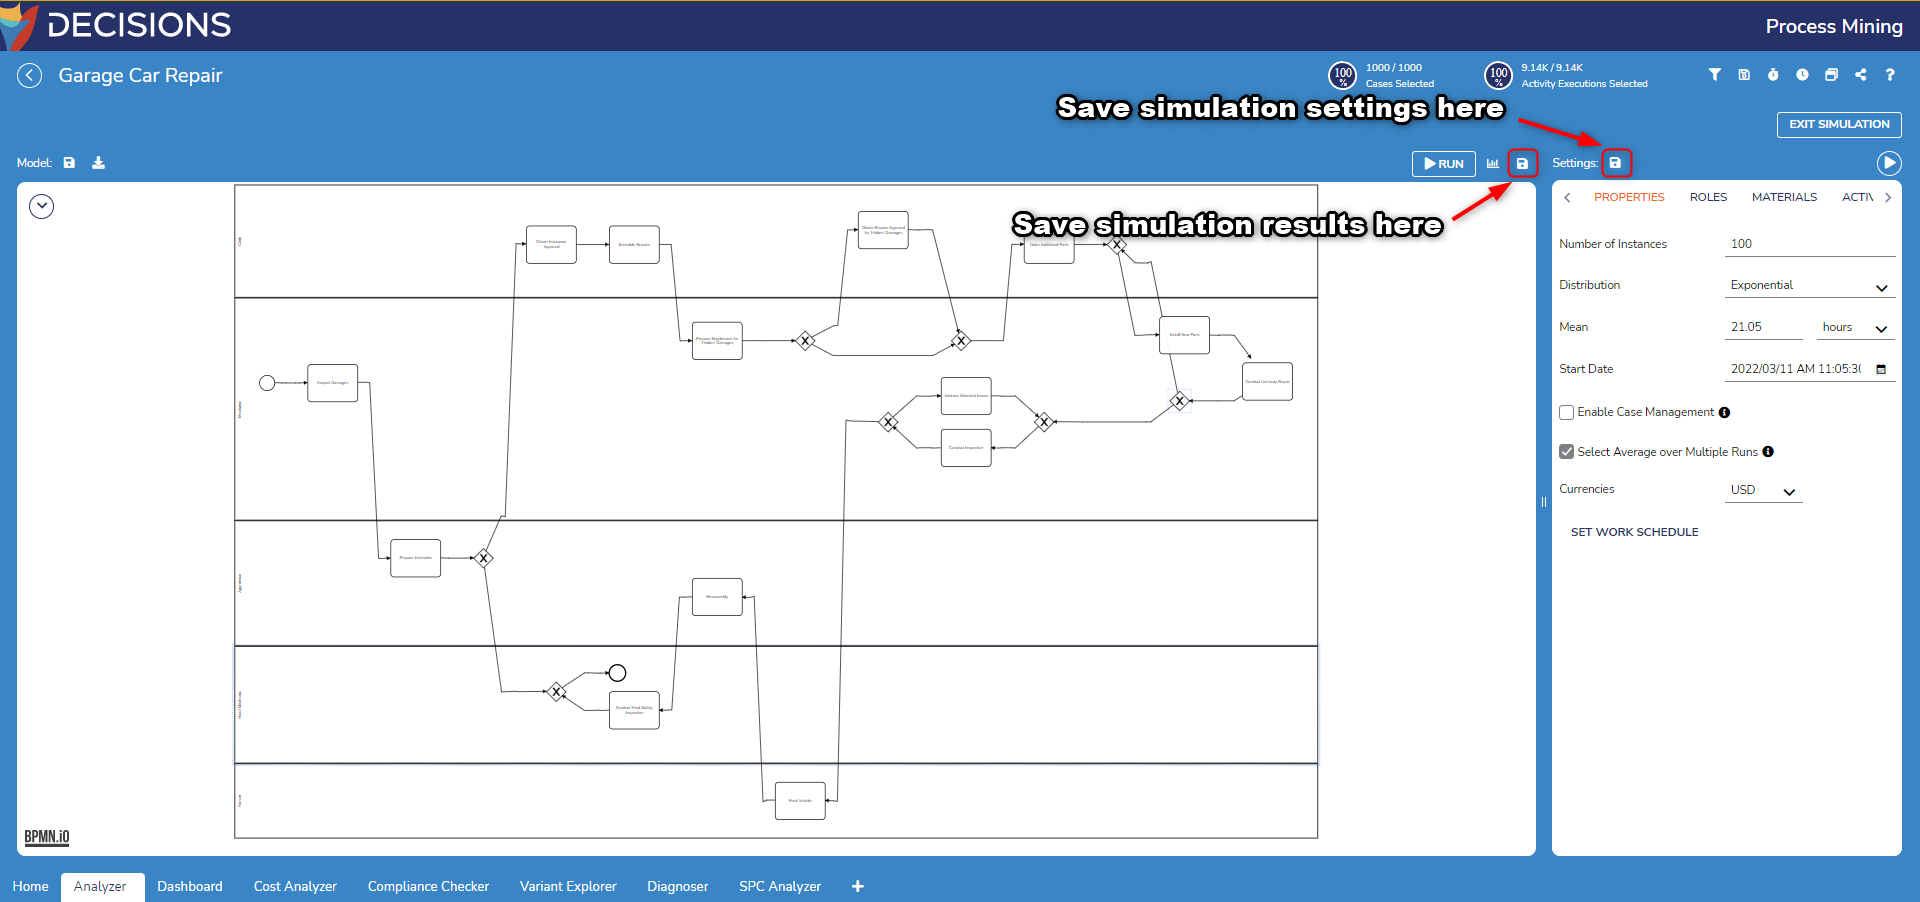


Was this article helpful?