Running Control Flow Compliance Checks
- 05 Dec 2023
- 4 Minutes to read
- Print
- DarkLight
Running Control Flow Compliance Checks
- Updated on 05 Dec 2023
- 4 Minutes to read
- Print
- DarkLight
Article summary
Did you find this summary helpful?
Thank you for your feedback
Overview
Control Flow compliance checks provide a visual comparison between a log/model and a reference log/model. Users may compare either two event logs, two BPMN models, or an event log and a BPMN model.
Furthermore the graph visualizes compliance variations of different colors based on the desired abstraction level:
| Color | Meaning | Example |
|---|---|---|
| Red | Elements of this color represent unexpected behavior that occurred in the log/model but should not exist according to the reference | Reworks, repetitions, and/or deviations |
| Green | Elements of this color represent missed behavior that should occur according to the reference but does not in the log/model | Skipped quality checks |
| Gray | Elements of this color represent compliant behavior | Necessary and performed activities in a process |

Expand violation details by double clicking on an activity of handover shown via a report. Every execution instance is displayed and available for selection.
To the right, the bar chart button displays a distribution chart of execution time. This allows users to compare compliant behavior performance in a log/model with the performance of the reference log/model.
The filter button to its right automatically applies a filter that retains only the following cases.

Furthermore, selecting the information icon at the right of each report item opens the entire execution trace of that particular execution.
Uploading a Reference Event Log or BPMN Model
To select a reference log/model:
- In the Control Flow Compliance Checker, select the Select Log/Model in the right side panel. This example then selects Select BPMN Model.
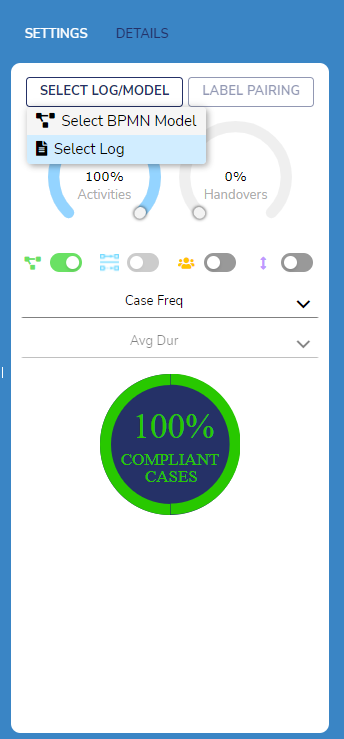
- The Select Log selection window then appears. Navigate to the desired reference log/model, select it, and then click on the Select button.
- Returning to the Compliance Checker view, the names of the comparing logs/models appear at the bottom right of the graph. The green name describes the reference while the red name denotes the base log/model.
If wishing to change the reference, users may select the red X besides its name and repeat the steps above for the new reference.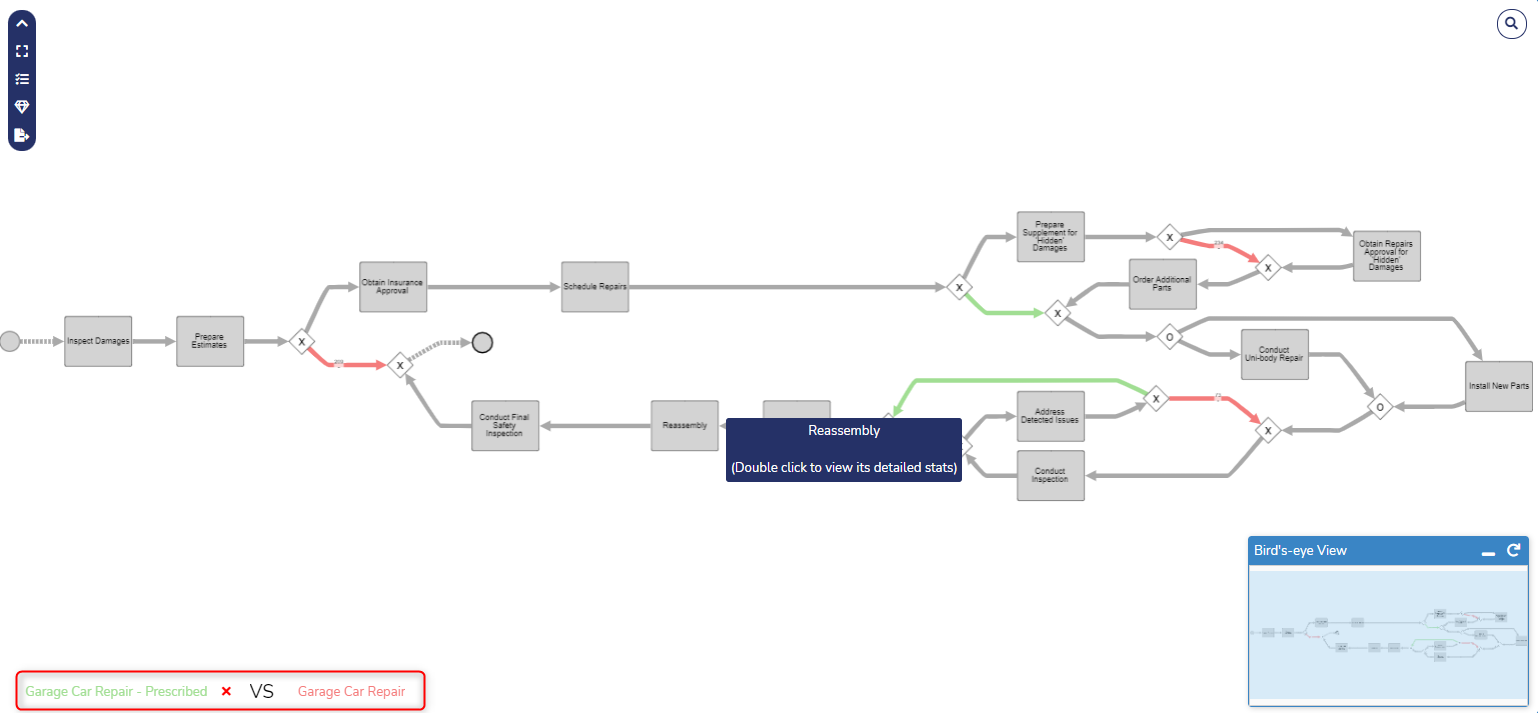


Syncing Logs/Models with Label Pairing
Control Flow compliance checks offer label pairing that automatically matches attributes of the same name together between the comparing logs/models. Pairing corresponding labels between the reference and the base log/model ensure further accuracy of their comparison results.
The following example details how to navigate to Label Pairing and how to create and remove label pairs.
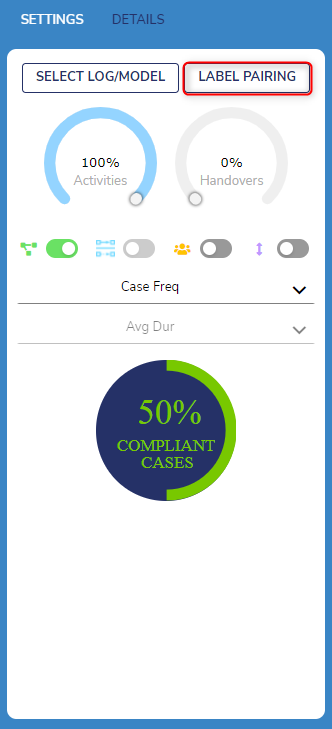
- Select the Label Pairing button in the right side panel to view the pairs labels for the check.
- In the Label Pairing window, automatically determined pairs are shown in the Paired Labels column on the right. Any attributes between the logs/models are shown in the other Label columns on the right.
Select an automatic pair on the right and then click on the < Remove button to deconstruct the pair and move it to the left columns,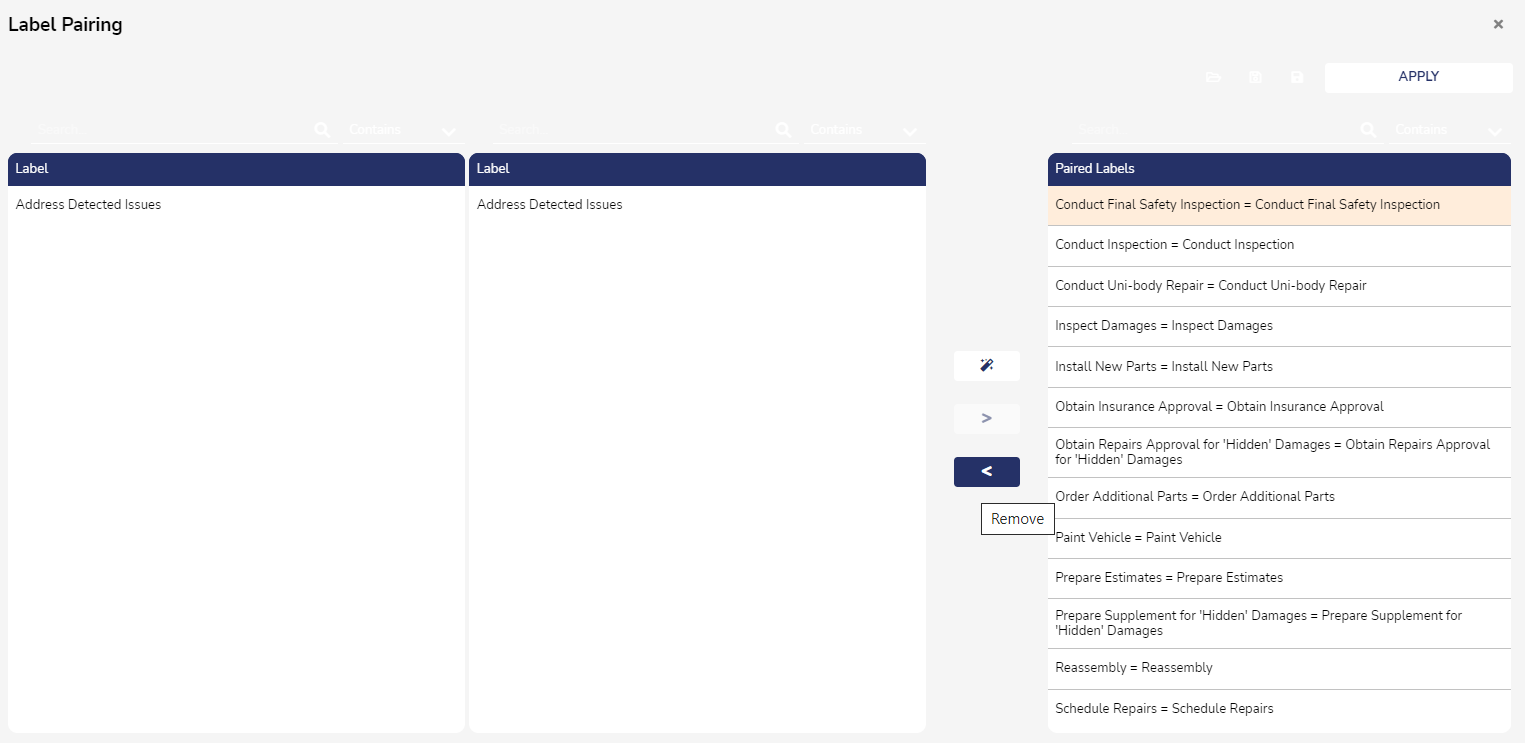
- To manually create a label pair, select one attribute from each of the left column and then select the > Add button.
- To run another automatic label pairing check, select the magic wand icon. Any created pairs join the other pairs in the right Paired Labels column.


Altering the Compliance Checker View
Users may configure the Compliance Checker's appearance similarly to the Process Map Analyzer with some notable distinctions.
Map Drop Down Menu
Expanding this drop down menu presents further options to customize the Control Flow from top to bottom:

Corner Box - Resize Map
The corner-box icon automatically adjusts the Process Map to fit the dimensions of its containing window,
Check List - View all Control Flow Violations
The bar chart icon opens all violations present in the control flow. Case Frequency displays the count and percentage of violations for all total executions in the log/model.
For executions containing violations, the Impact on Average Case Duration states how the presence of violations effects completion time compared to those without.

Diamond - Event Log Animation
All entries within the event log may be replayed within the map to provide a chronological, dynamic representation of each execution in a process. The animation's bird's-eye-view allows for easier detection of process hotspots and bottlenecks as well as for easier comparison of executions with multiple variants.
Upon selecting the diamond icon, the Log Animation Settings window appears allowing for animations to show one or multiple variants and to what color represents them.
The Synchronize Cases checkbox toggles the timelines of the executions so the animation of all cases starts at the same time.
When selecting multiple The Synchronize Variants checkbox toggles the timelines of the executions so the animation of all variants start at the same time.
Download Icon > Download Map as Image
Downloads the Compliance Checker graph as either a PNG or a JPEG image file. The file's resolution and dimensions can be manually configured.

Side Panel Tabs
Above the side panel, the following options change its contents when selected:
- Settings: Shows settings and sliders available to configure the Compliance Checker graph
- Details: Shows event log executions, the number of variants, their frequency, and percentage occurrence in the entire event log. The variant's path can be displayed as a graph.
Sliders
The Activity and Handover sliders above the map adjust how much/little infrequence activities and/or handovers are displayed on the process map.
Reducing the sliders removes the amount of elements within the graph.
For most use cases, it is recommended to set both these sliders to 100% to generate a fuller model that may towards more involved insights.

Toggle Buttons
The toggles buttons above the Process Map alter the Process Map. The following table describes their functions ordered from left to right.

| Icon | Function |
|---|---|
| Connected Squares | Toggles between viewing the event log as a process map or a BPMN model |
| Square of Squares | Toggles appearance of side-by-side display of the reference log/model and the base log/model |
| Group of People | Toggles visibility of resources involves in the process |
| Up and Down Arrow | Toggles layout between horizontal and vertical |
Primary and Secondary Information Drop Down Menu
These drop down menus change which primary and/or secondary information is displayed for the activities and handovers.
Compliance Percentage Chart
This chart displays how many executions in the event log pass all compliance checks shown as a percentage.

Was this article helpful?