Introduction
The Global Debugger allows users to have more flexibility in troubleshooting Designer Elements. It runs similarly to a profiler, and when turned on, it will capture running Flows and processes that are occurring. This helps troubleshoot processes that cannot be debugged efficiently with the Flow Designer Debug action. Scheduled Job Flows and Page Designer Tile Flows are two kinds of processes that are more easily troubleshot with the Global Debugger.
Global Debugger Practices
Enabling this feature in Production environments is not recommended. When the Global Debugger is not required for data capture, it should remain disabled, as leaving it enabled can significantly impact performance.
If the active debugger tab has been closed, selecting the icon in the Help Center will display a "Stop Global Debugger" action.
If the active debugger tab has been closed, selecting the icon in the Help Center will display a "Stop Global Debugger" action.
Enabling Global Debugger
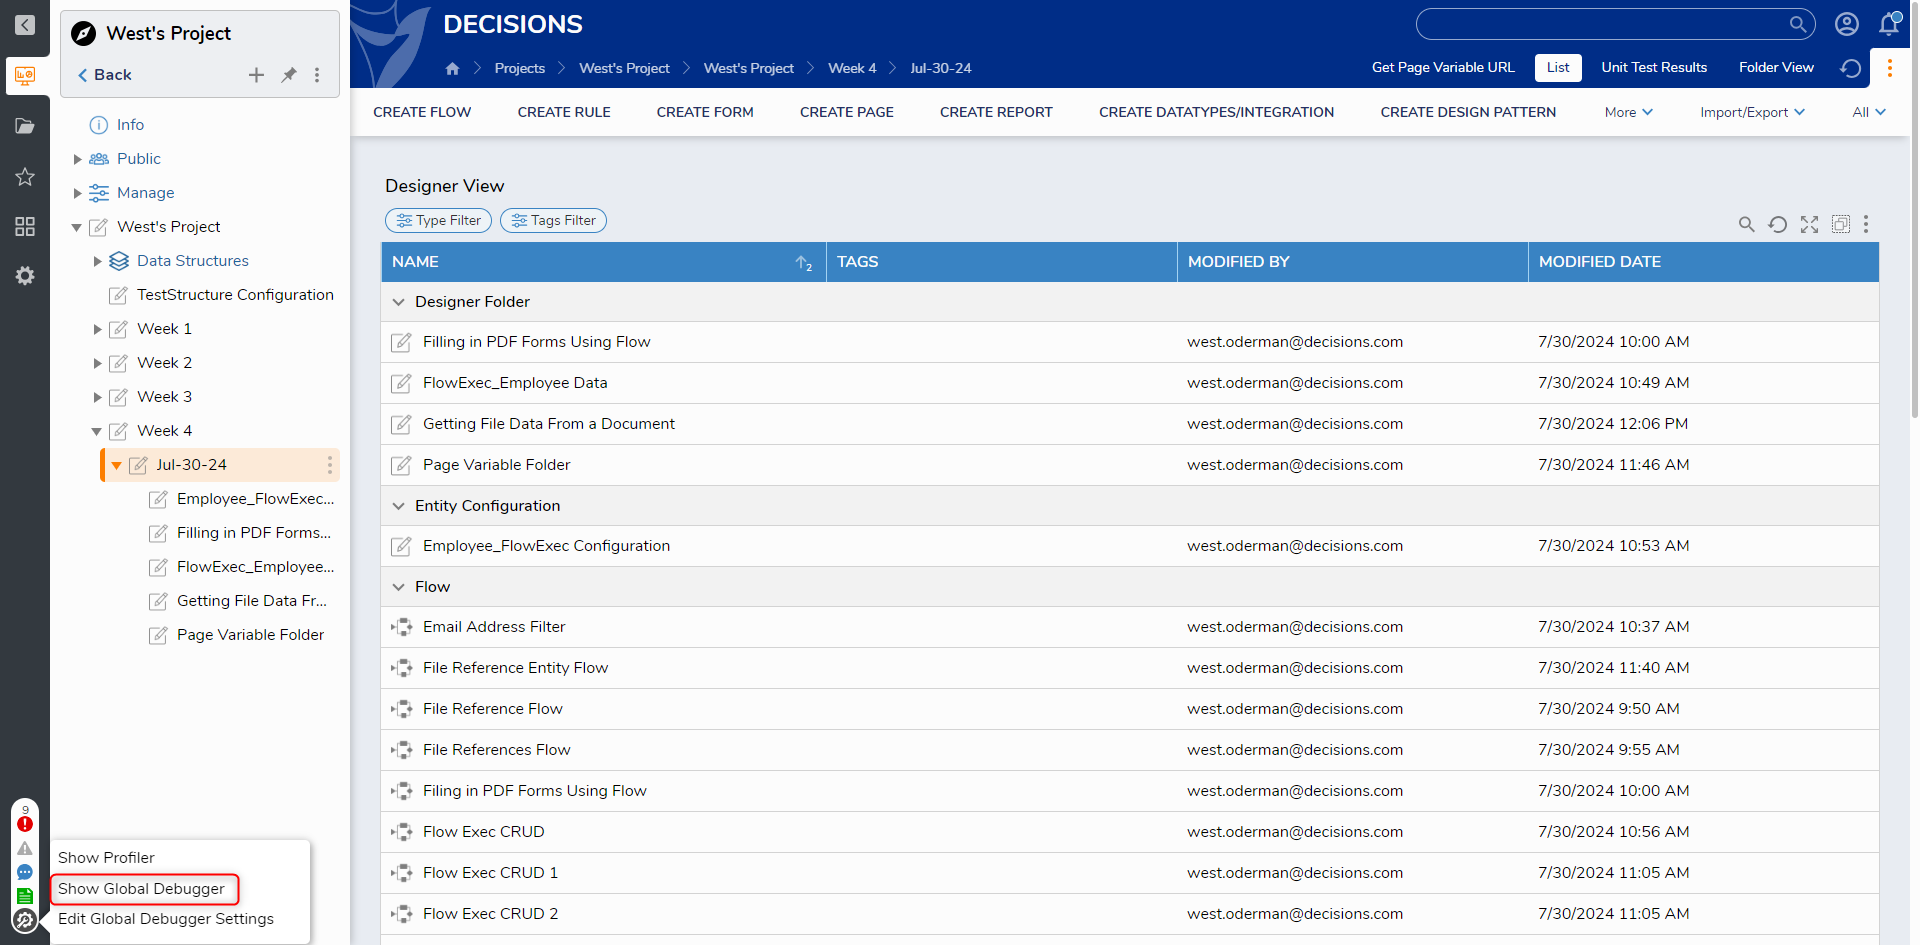
- The Global Debugger can be enabled in the Designer Studio by clicking the wrench and cogwheel icon in the bottom left corner of the Decisions Studio and selecting Show Global Debugger.
- This action will open a new browser tab, taking the user to the Global Debugger home Page. Select the toggle in the top left corner to turn the Global Debugger on. The Global Debugger features three drop-down options.
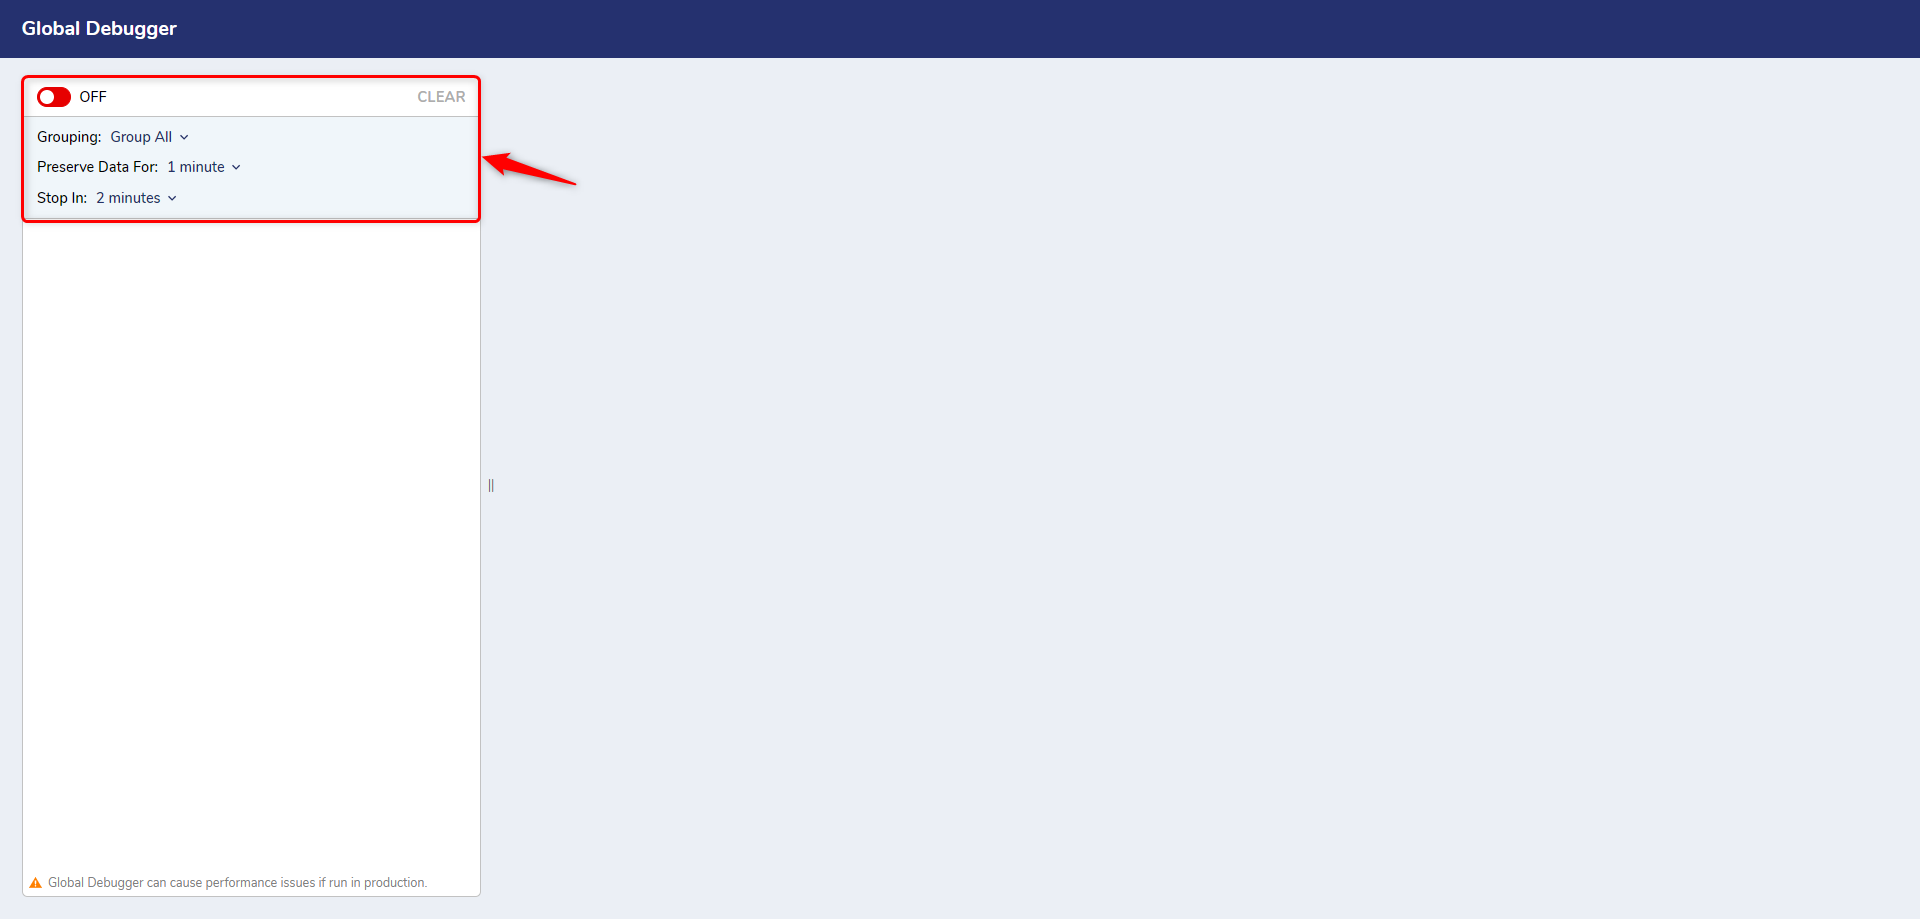
- Grouping:
Grouping Options Description No Grouping All Debugging data will appear individually Group All Groups all related data that can be expanded for details Group Consecutive Groups related process that were executed shortly after each other - Preserve Data for: The Preserve Data for option controls when the debugged data will refresh. This will preserve the cache of the debugger data only for the number of minutes that is configured. This can be set for different pre-defined intervals, or users can select the custom option to declare a refresh time interval.
- Stop in: Sets the time to stop the Debugger automatically.
- Grouping:
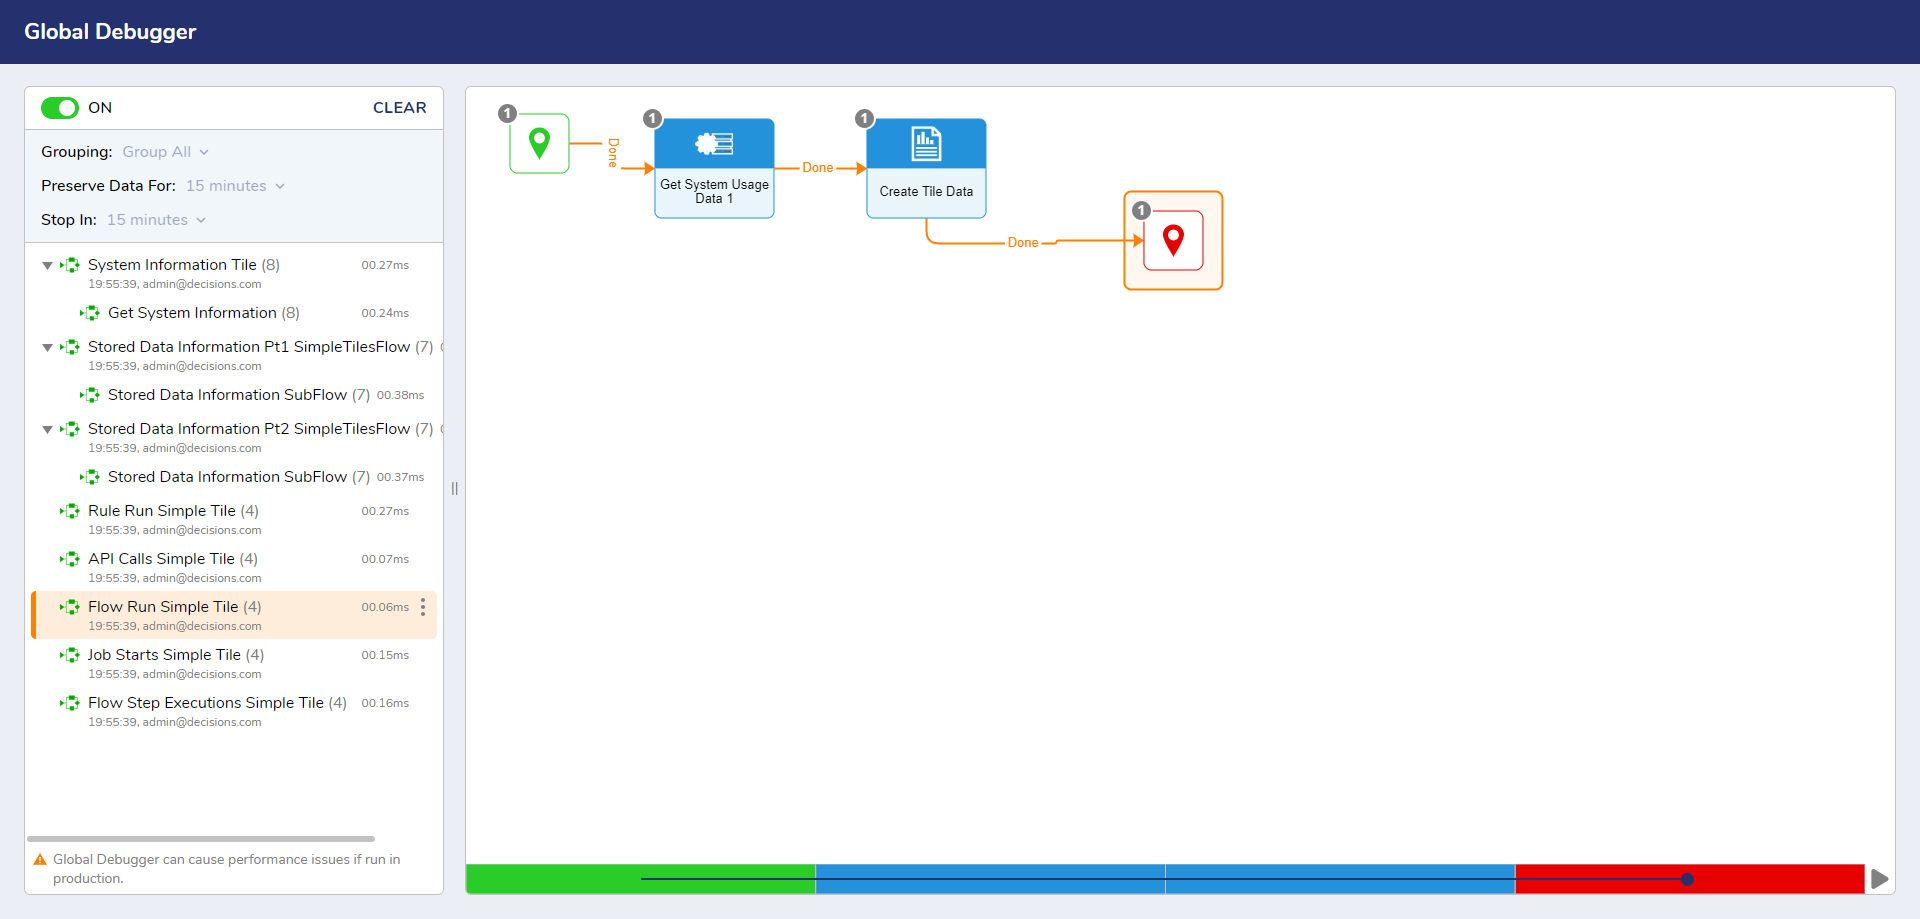
- Once the Global Debugger starts capturing the data you can view it by clicking on the respective flow and viewing the data.
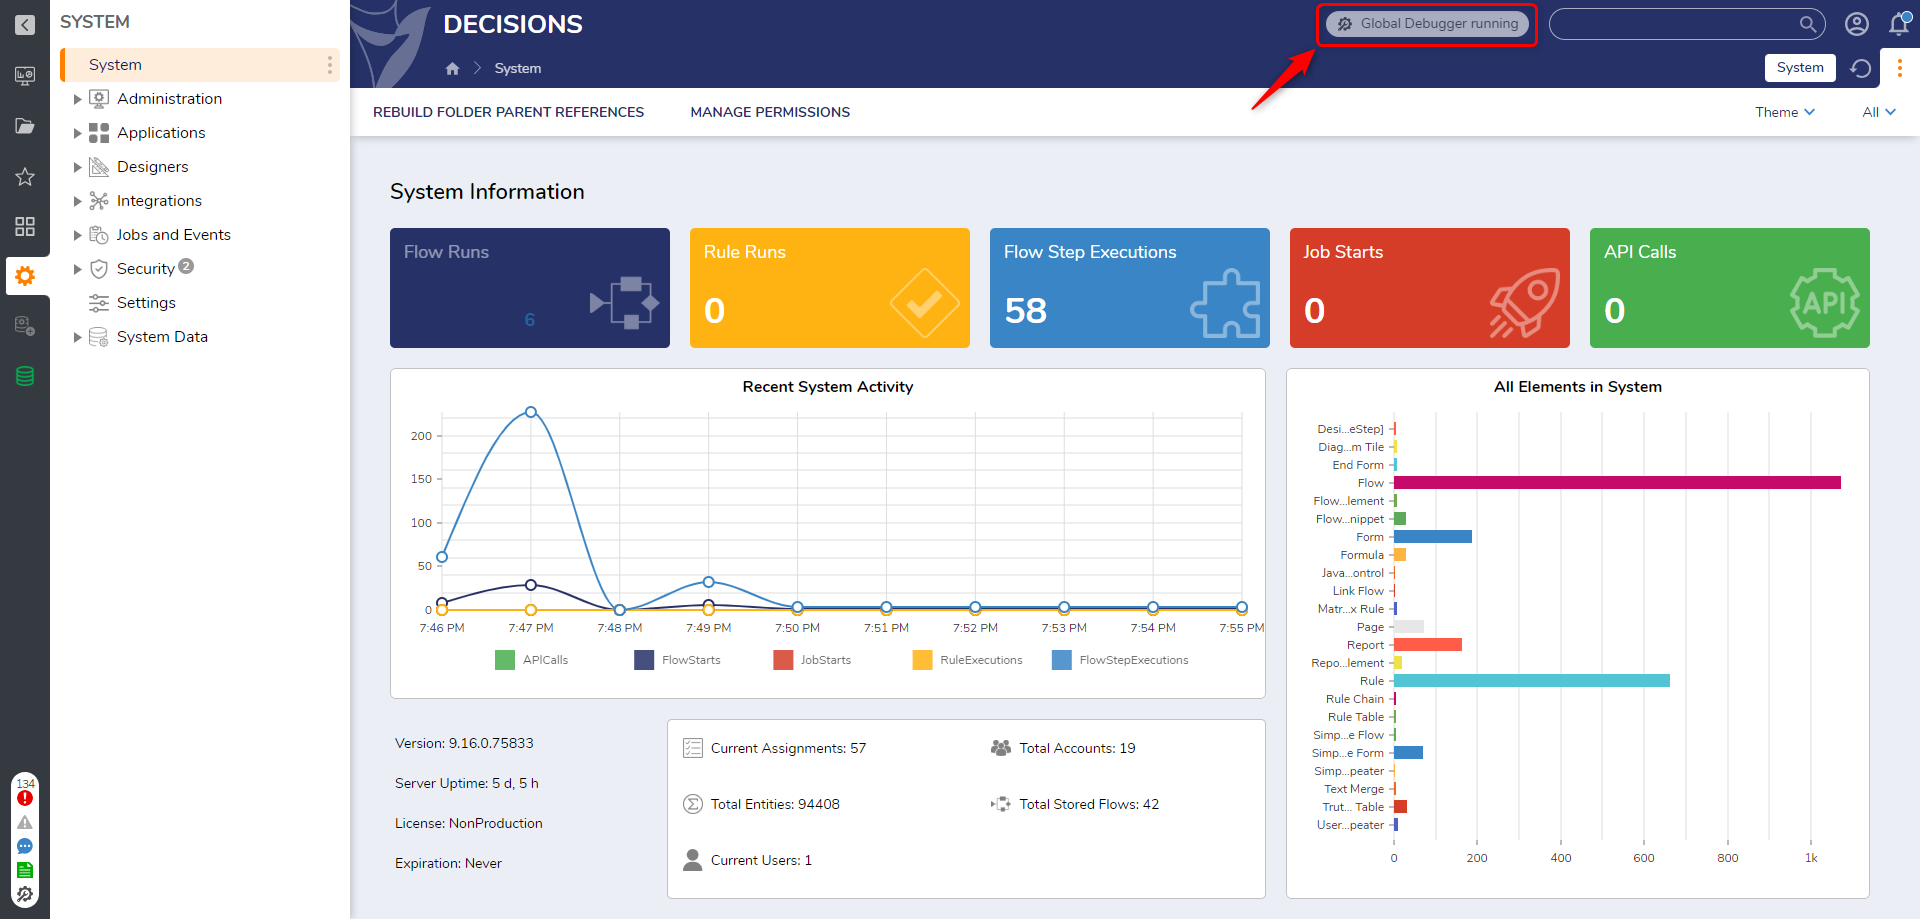
- When the Global Debugger is enabled and configured, an alert will be visible at the top of the Designer Studio.
Global Debugger Settings
The Global Debugger settings menu is used to set default values. Global Debugger Settings can be configured via 2 locations in the Portal.
- System > Settings > Global Debugger Settings
- Help Center > Tools > Edit Global Debugger Settings
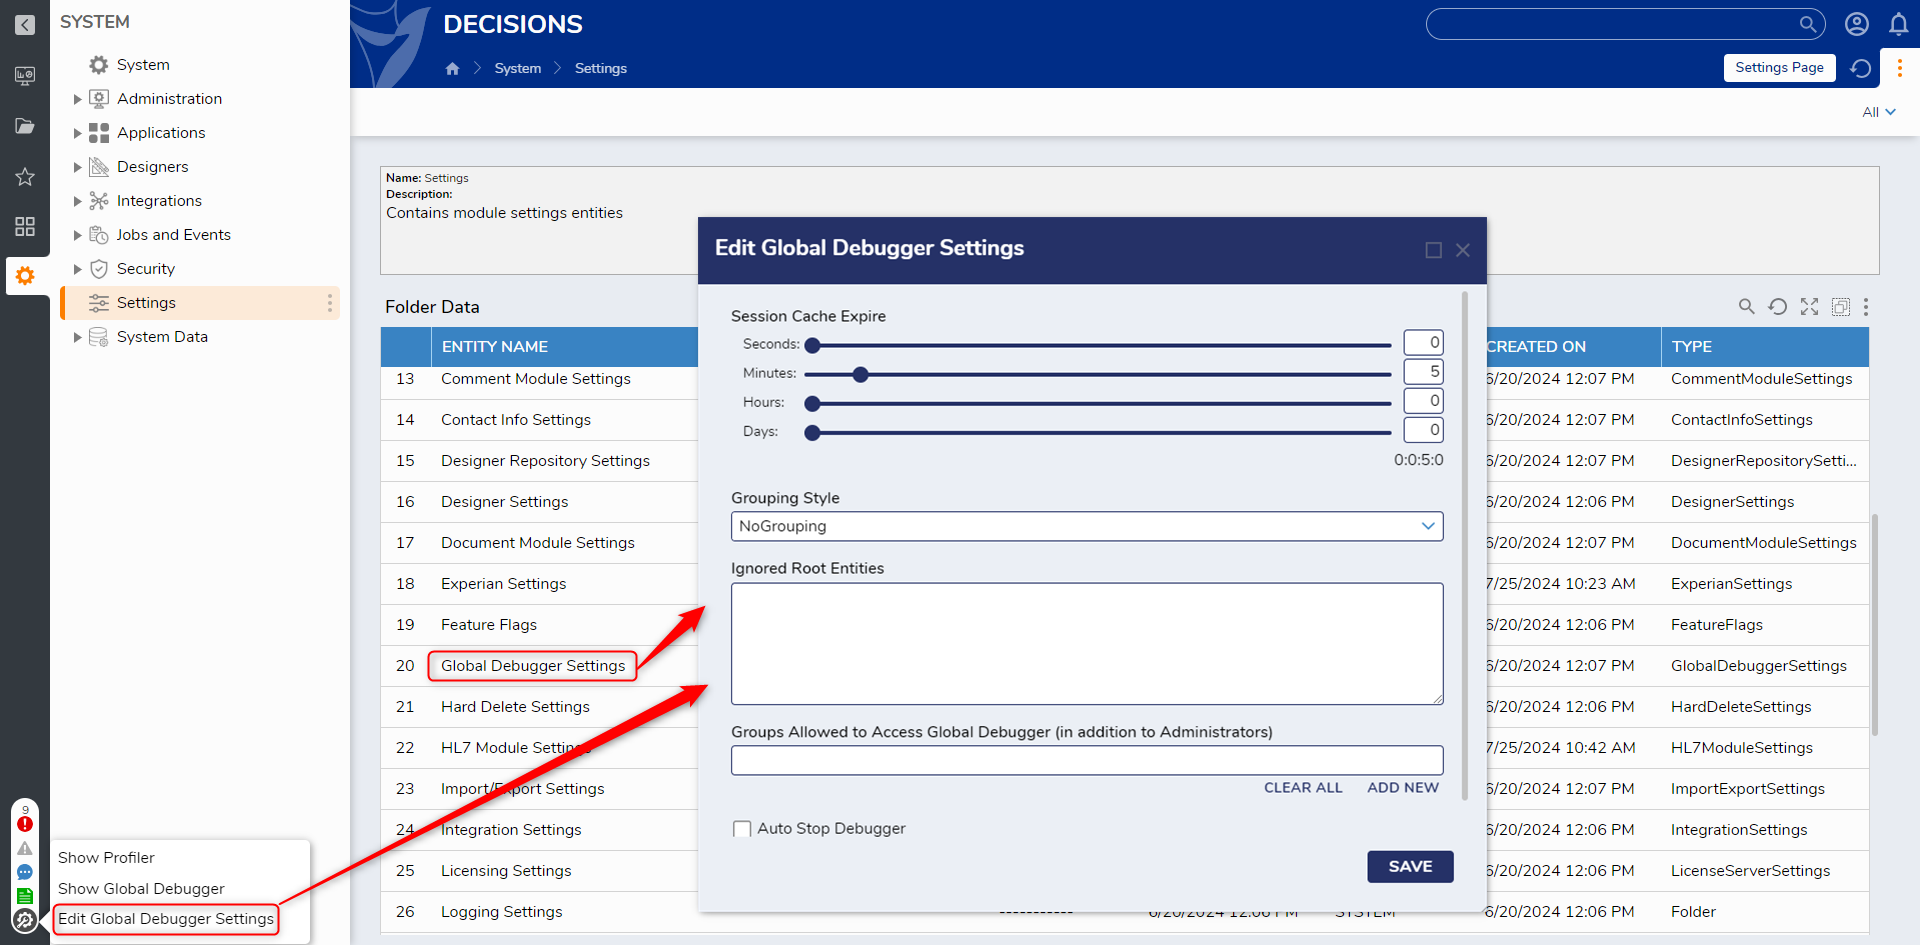
| Configuration Name | Description |
|---|---|
| Session Cache Expire | This will preserve the cache of the debugger data only for the configured time. This setting is the same as Preserve Data for, which is available when the debugger is turned ON. For e.g., if configured for 2 mins, it will only show debugger activities for the last 2 mins. |
| Grouping Style | Groups all related data that can be expanded for details. This Setting is the same as Grouping, which is available when the debugger is turned ON. |
| Ignored Root Entities | This takes the input as Entity ID. The debugger will ignore these Entities when the Global Debugger is Running. |
| Groups Allowed to Access Global Debugger | Global Debugger will be allowed to access only those groups which are added to this field. By default, the Administrators group has access to the global debugger. |
| Auto Stop Debugger | When enabled, gives access to configure the time to Stop the Debugger. |