Overview
The ERD Generation feature introduces a read-only Entity Relationship Diagram (ERD) page that visually represents user-defined data types and supported database integration structures in a Project. Instead of opening each Data Structure or Database Integration individually, users can open the ERD page to review available structures and their fields in a single, centralized view.
This helps Designers and administrators better understand how data is organized across a Project, especially in larger Projects with multiple Data Structures and Database Integrations.
Business Use Case
Users working with multiple data structures often need a quick way to understand how data is organized across a Project. The ERD page helps users:
- Review user-defined types in a centralized visual layout.
- Understand the fields available within each structure.
- View supported database integration structures in a diagram format.
- Identify how data structures are organized before building Flows, Reports, or Rules.
- Communicate data model design more clearly with development, QA, or business teams.
Before You Begin
To view content on the ERD page, the Project should contain at least one supported structure. Supported items include:
- User-defined data types
- Database integrations
- Local database integration tables
Where to Find the ERD Page
The ERD page is added to every project automatically. No setup or configuration is required to enable it.
- Open the desired Project.
- Navigate to Manage > Integrations > Databases.
- Select the ERD page.
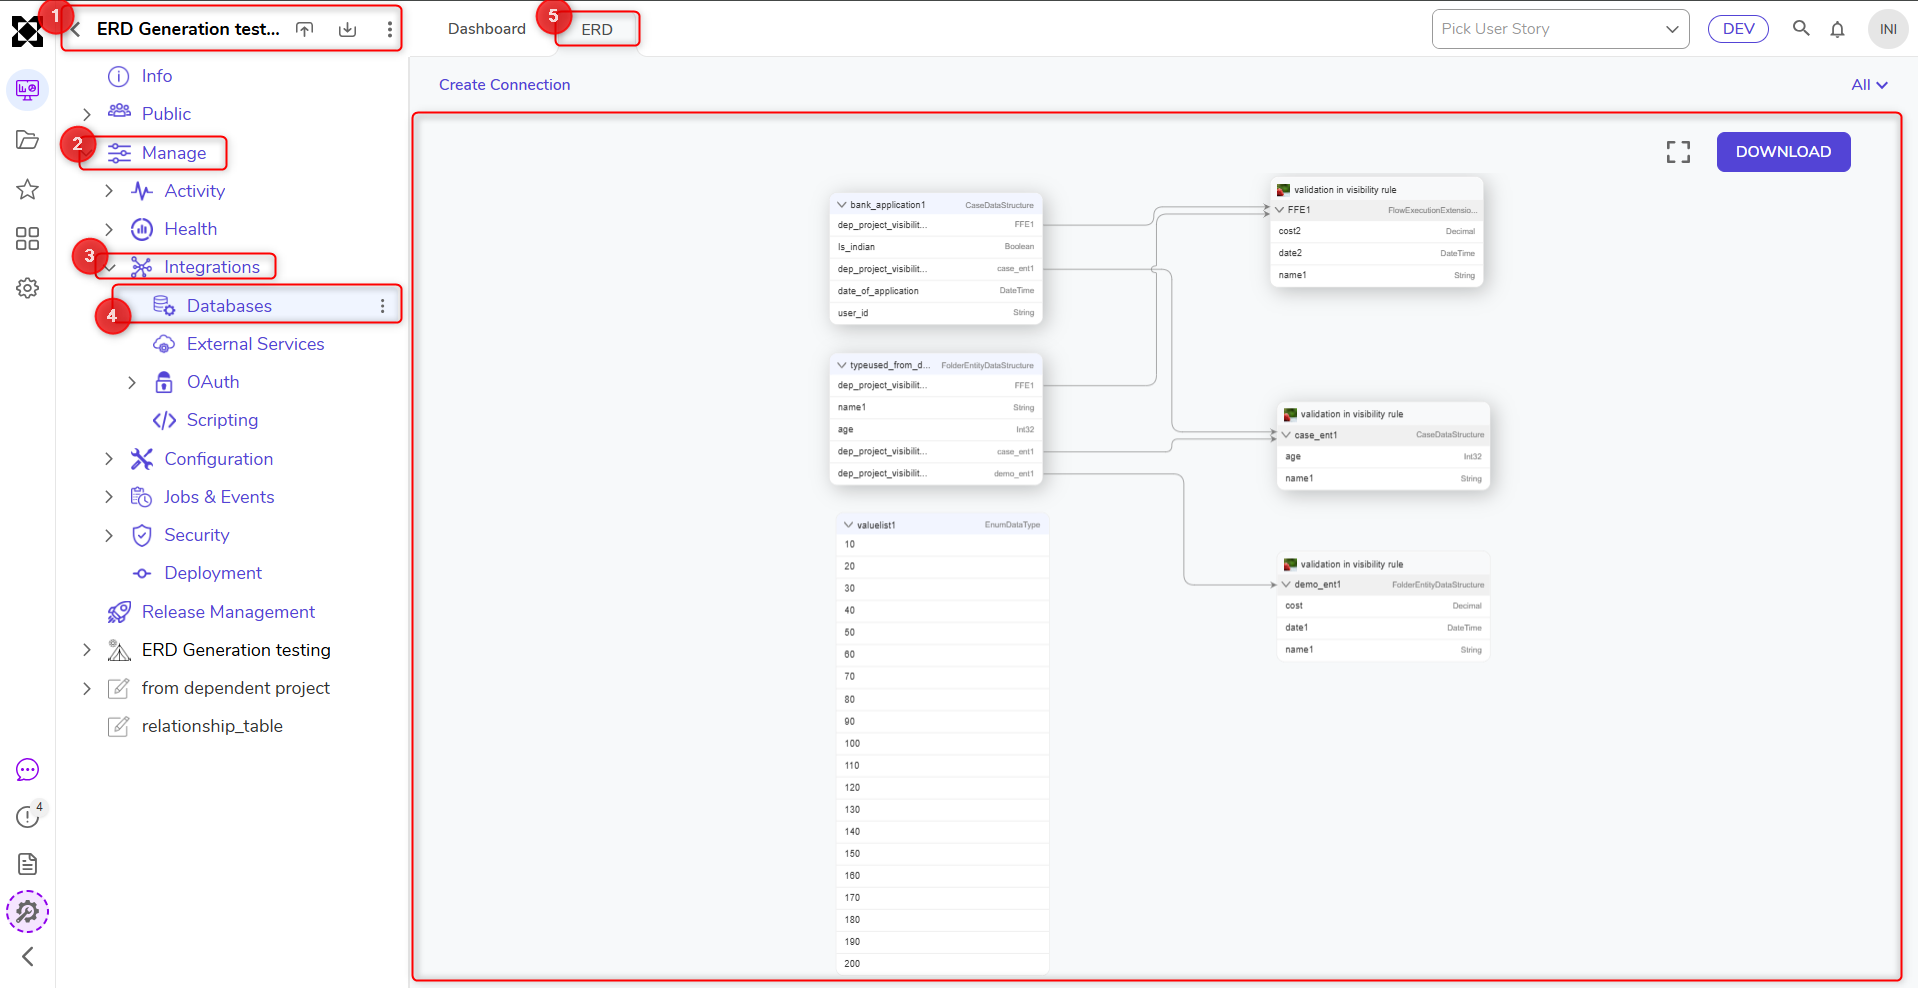
Click the Download button to save the ERD as a PNG file.
What Appears on the ERD Page
When the ERD page is opened, each supported structure is displayed as its own table-style object on the canvas. This includes user-defined data structures created from any of the available types in the **Create Data Types and Integrations** window, as well as supported database integration structures.
Each structure on the diagram may include:
- Structure name
- Field names
- Field data types
- Available database integration fields, where applicable
For example, if a Project contains user-defined types such as Customer, Order, Invoice, and Address, each type appears as its own structure on the ERD page.
Relationship Types Visualized
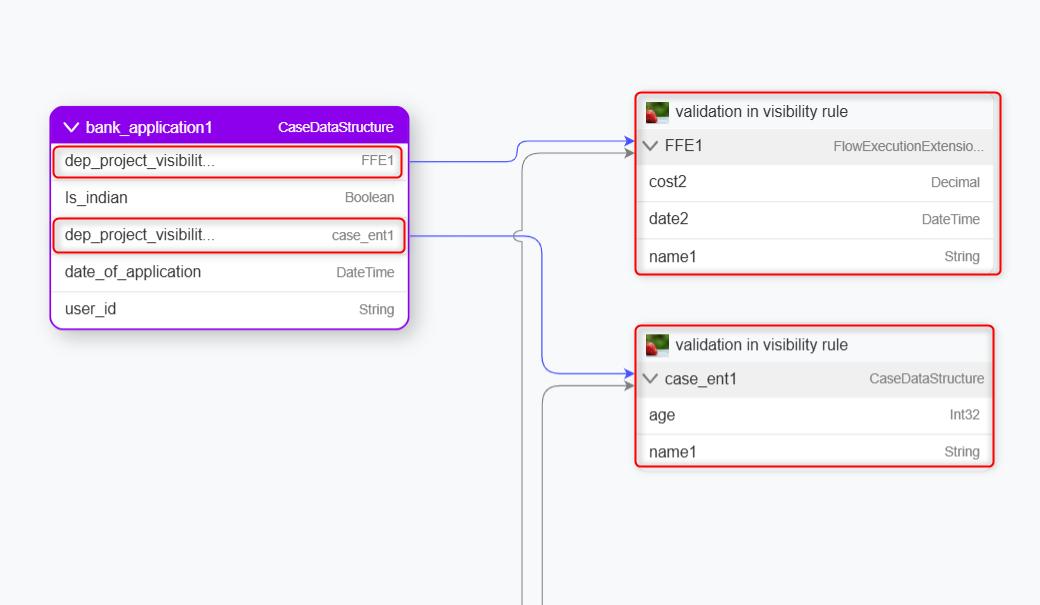
The ERD page draws a connector between two structures whenever one of the following relationship types exists:
| Relationship Type | What It Looks Like on the ERD |
|---|---|
| Database Integration Relationship | A relationship created between two locally integrated database tables is shown as a connector between the two tables. External table relationships are not included. |
| Composite Data Type (Structure-in-Structure) | When one Data Structure is added as a field type inside another, the parent structure's table keeps that field as-is, showing the referenced structure's type name next to it (for example, a field named dep_project_visibility with type FEE1 (FlowExecutionExtension)). The ERD draws a connector from that field to the referenced structure's own table, which is displayed separately on the diagram with its own fields. |
Viewing the ERD
The ERD page is view-only. Structures and connectors cannot be edited, created, or deleted from this page.
Users can:
- View the available structures on the canvas.
- Review the fields configured within each structure.
- Move structures around the canvas, where supported.
- Scroll across the page when the diagram contains multiple structures, using the horizontal and vertical scrollbars that appear automatically.
To make changes to a structure or its relationships, close the ERD page and use the Data Structure editor or the relationship integration dialog directly.
Feature Changes
| Description | Version | Release Date | Developer Task |
|---|---|---|---|
| ERD Generation page introduced under Manage > Integrations > Databases, displaying user-defined data structures and their relationships in a read-only diagram. | 10.0 | July 2026 | [DT-042033] |