Creating a Custom Process Dashboard
- 05 Dec 2023
- 3 Minutes to read
- Print
- DarkLight
Creating a Custom Process Dashboard
- Updated on 05 Dec 2023
- 3 Minutes to read
- Print
- DarkLight
Article summary
Did you find this summary helpful?
Thank you for your feedback
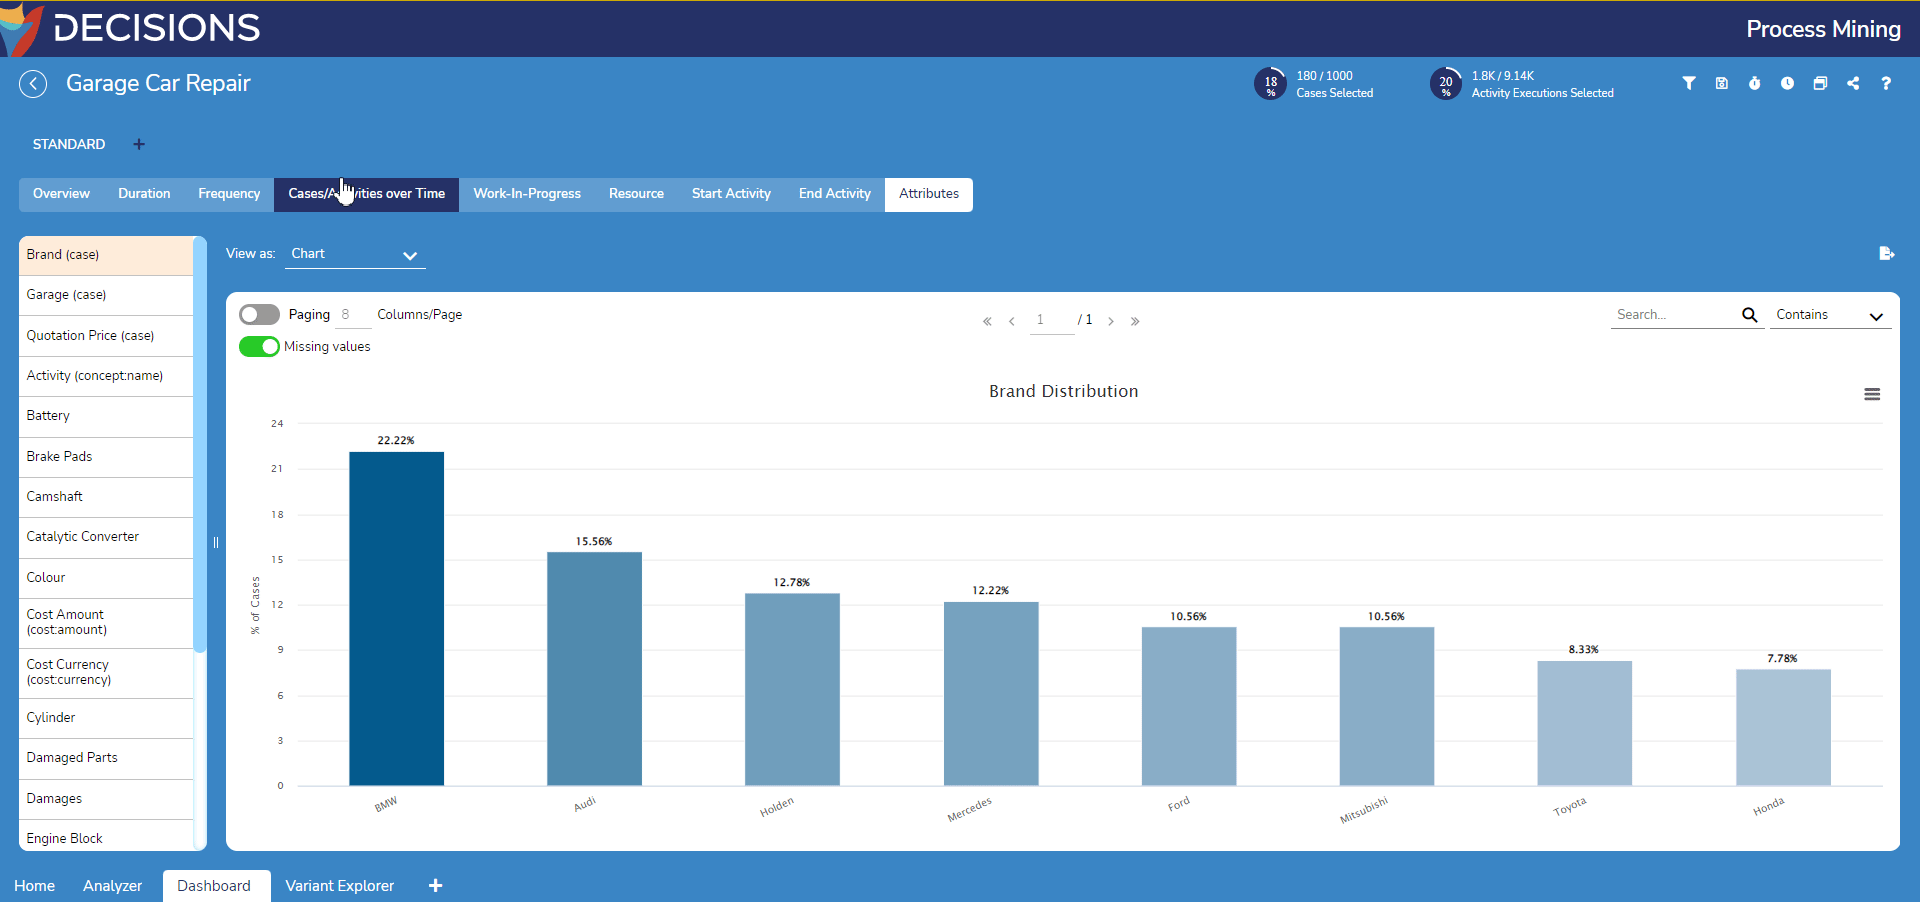
Overview
Creating a custom Process Dashboard allows users to track their own KPIs by dragging and dropping a combination of dynamic and static dashboard components.
Example
- Open an event log in Decisions Process Mining and navigate to the Dashboard tab.
- Select the plus icon to the left of the Standard tab on the Process Dashboard.
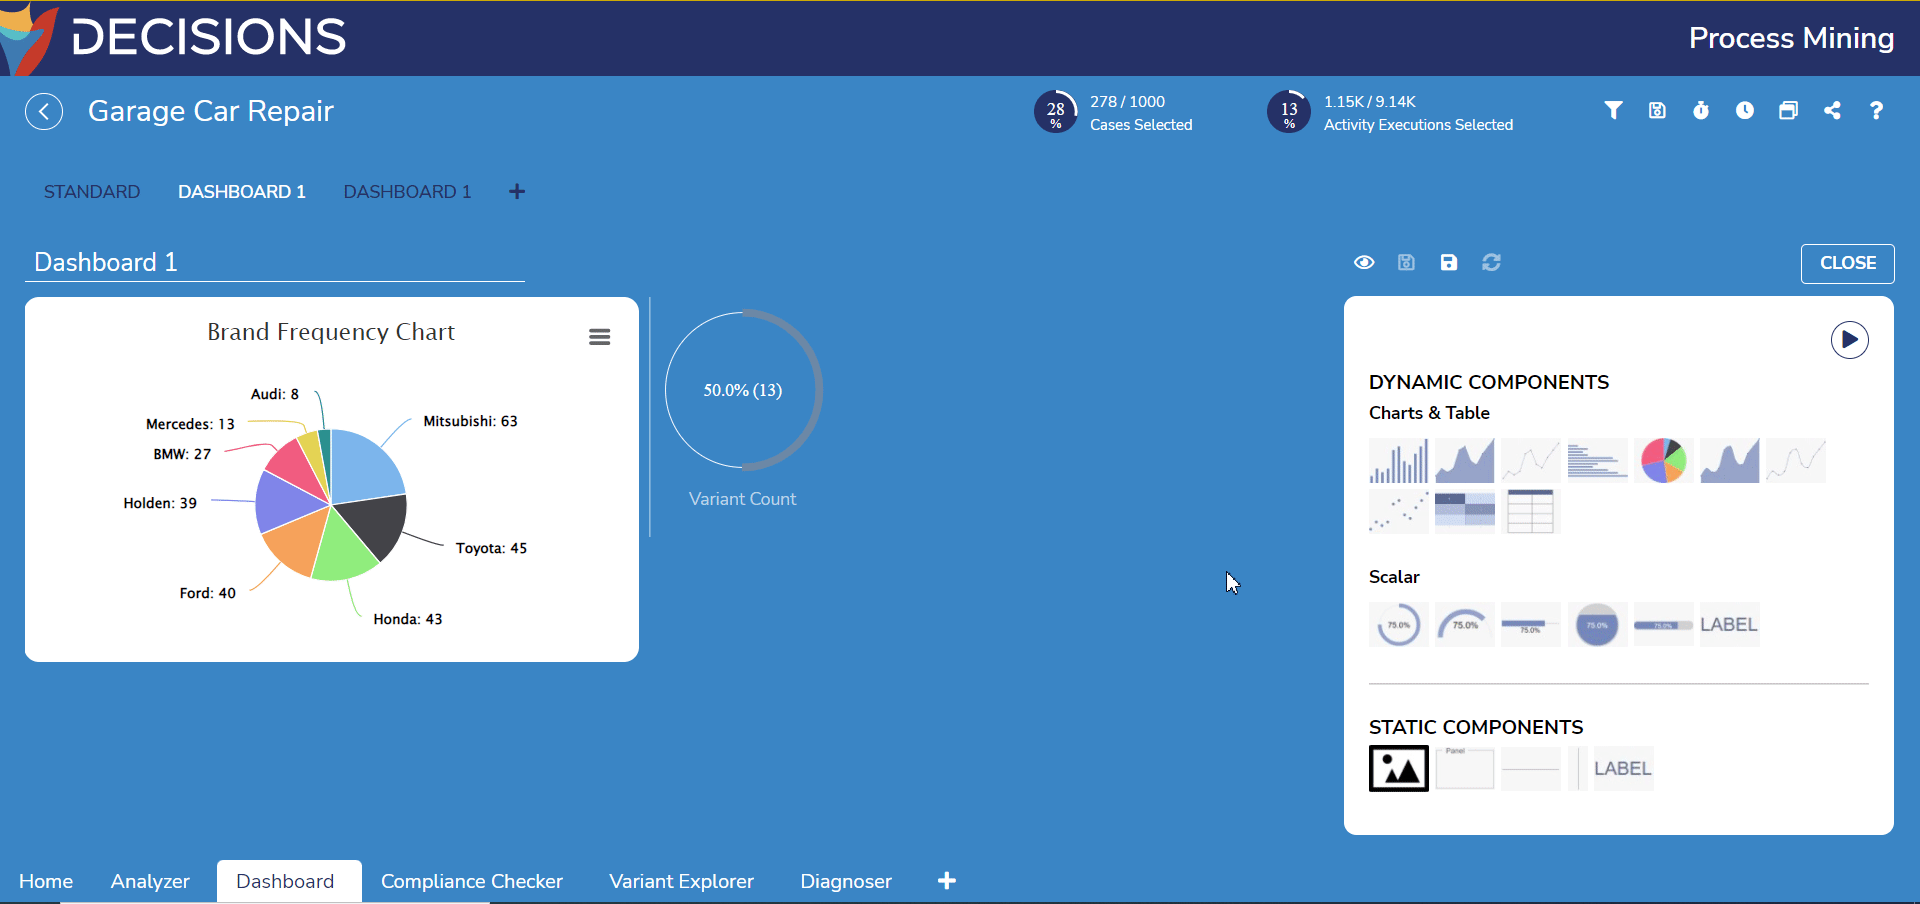
- Select the CREATE A NEW DASHBOARD. This will automatically open the new empty Dashboard named 'Dashboard 1'. Clicking on this name allows the users to edit it.
- Drag a Pie Chart component from the Component Palette on the right to the empty workspace on the left. Its setting will automatically replace the Component Palette once added.
- Under Data Query, change the Chart Title to a more data-descriptive name. For this example, this chart is named 'Brand Frequency Chart'.
- For the X Axis, click on Click to Select Data to open the Visual Query Builder to select the dimension of the chart.
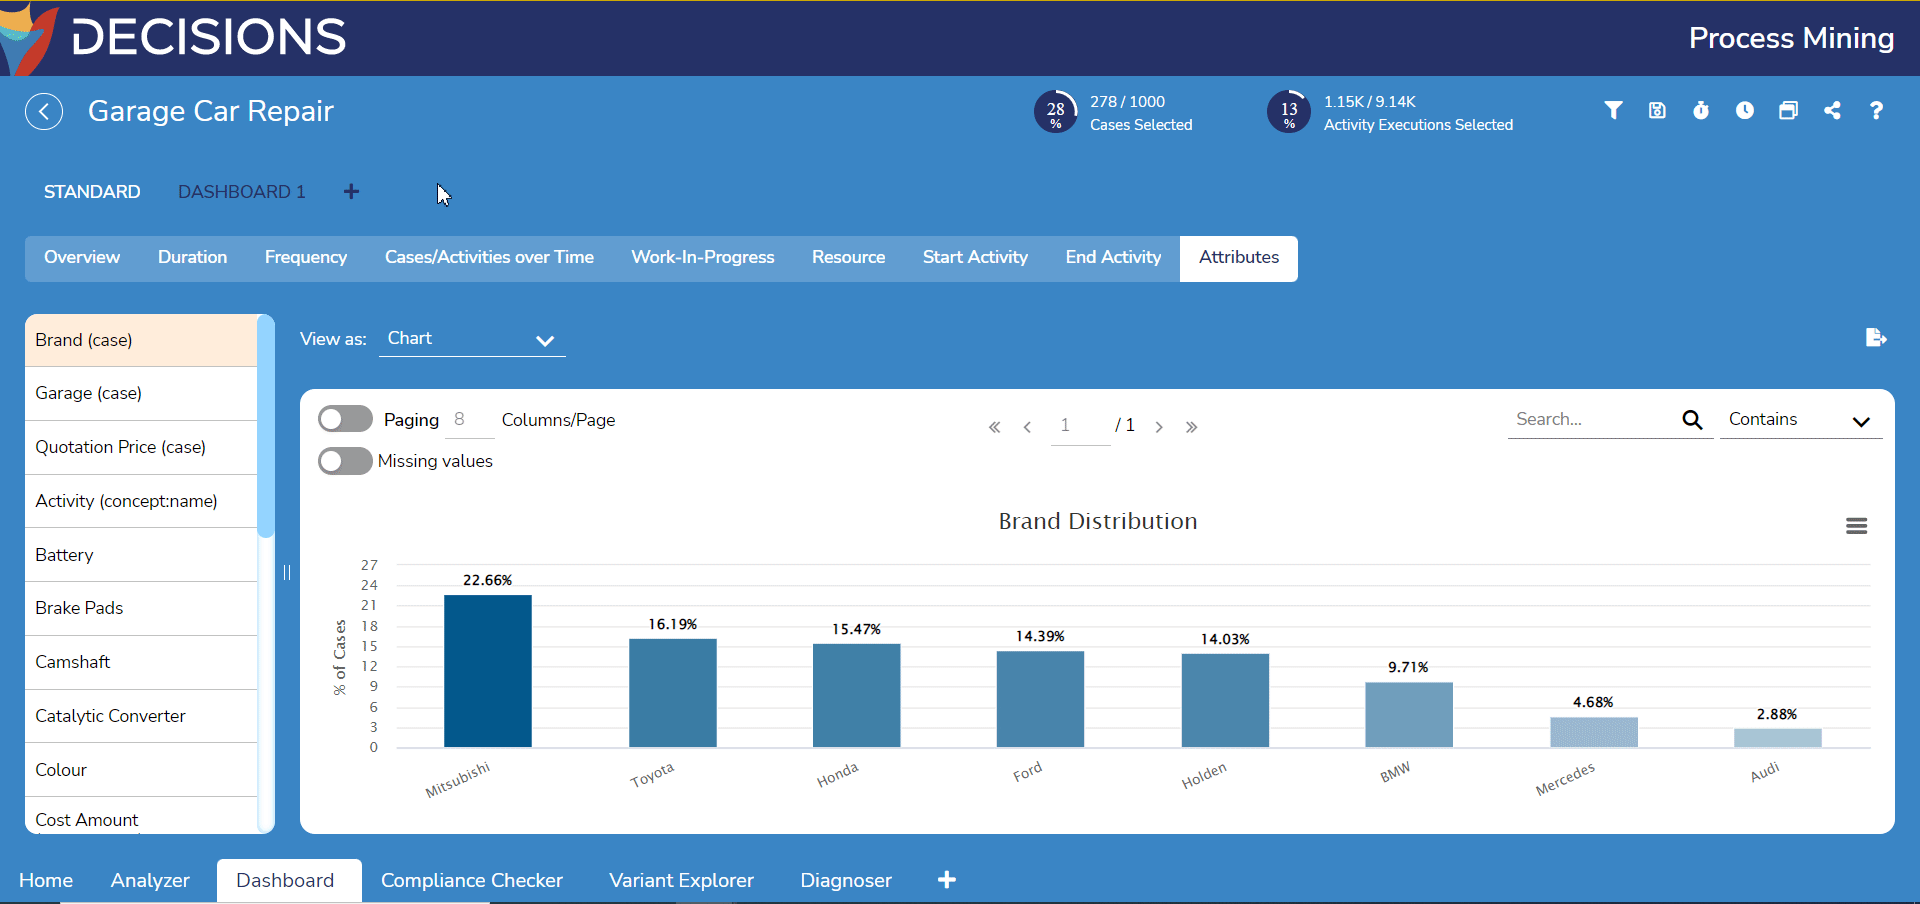
For this example, select the dimension Case > Attributes > Brand > All Values to capture all car brand attributes present in the event log. Select OK to confirm.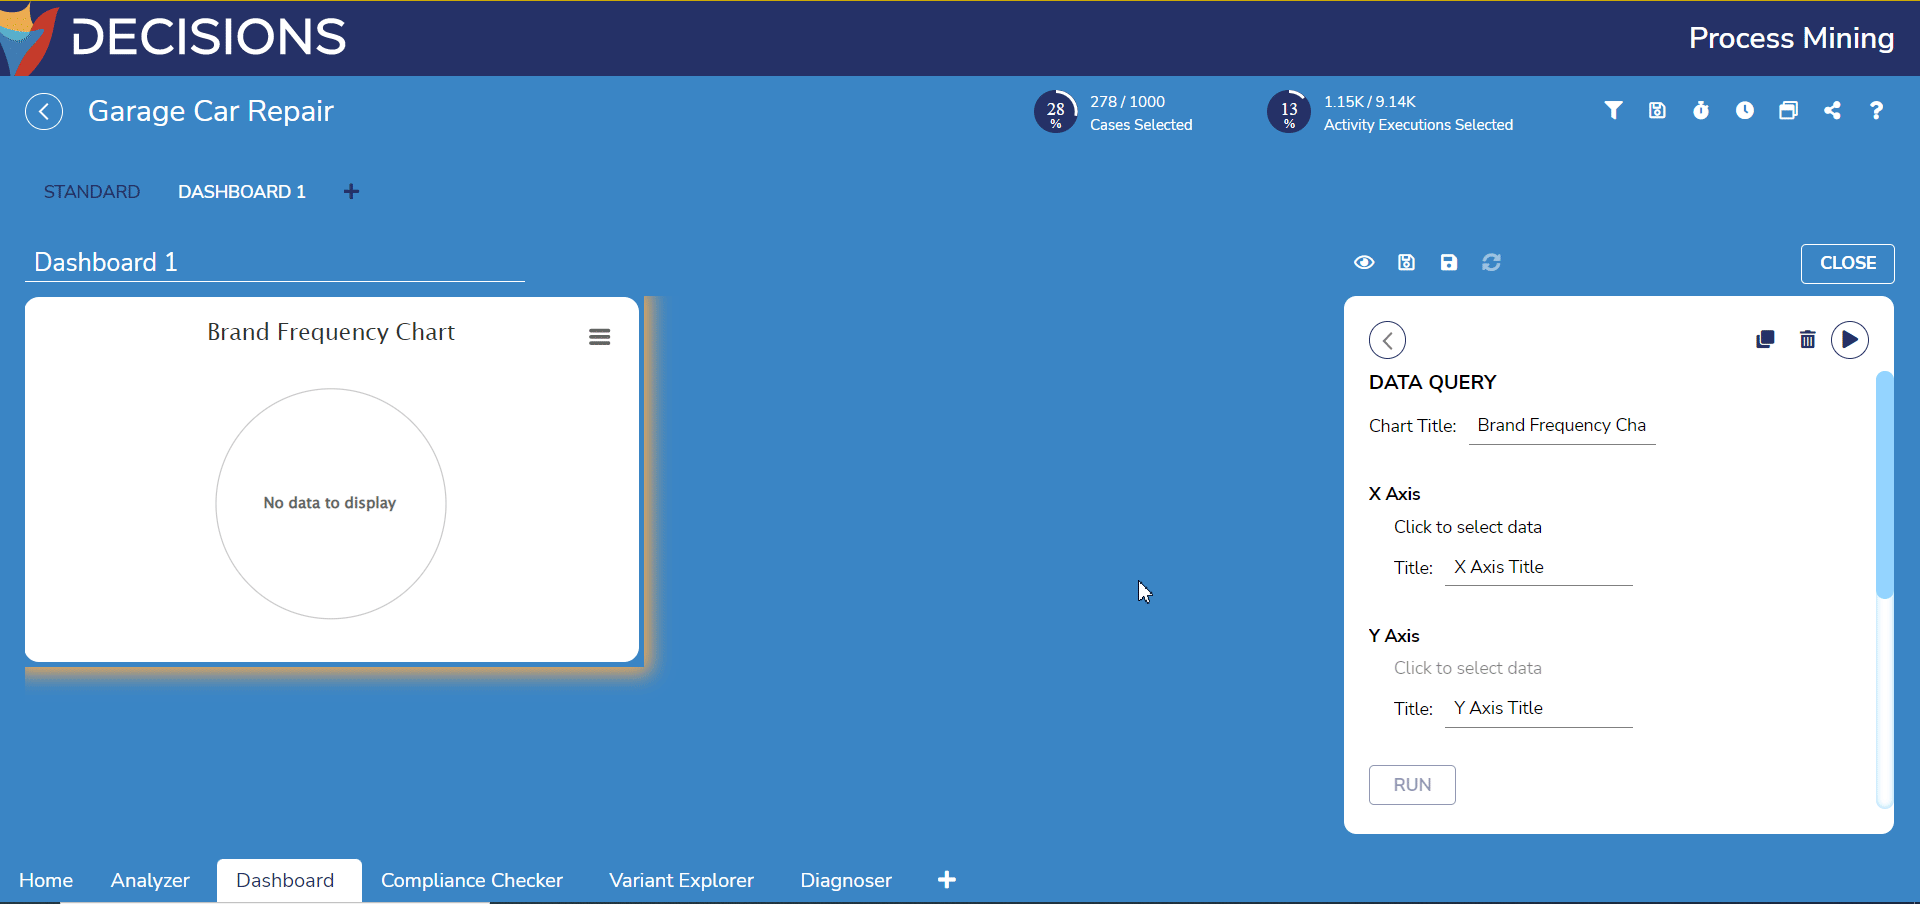
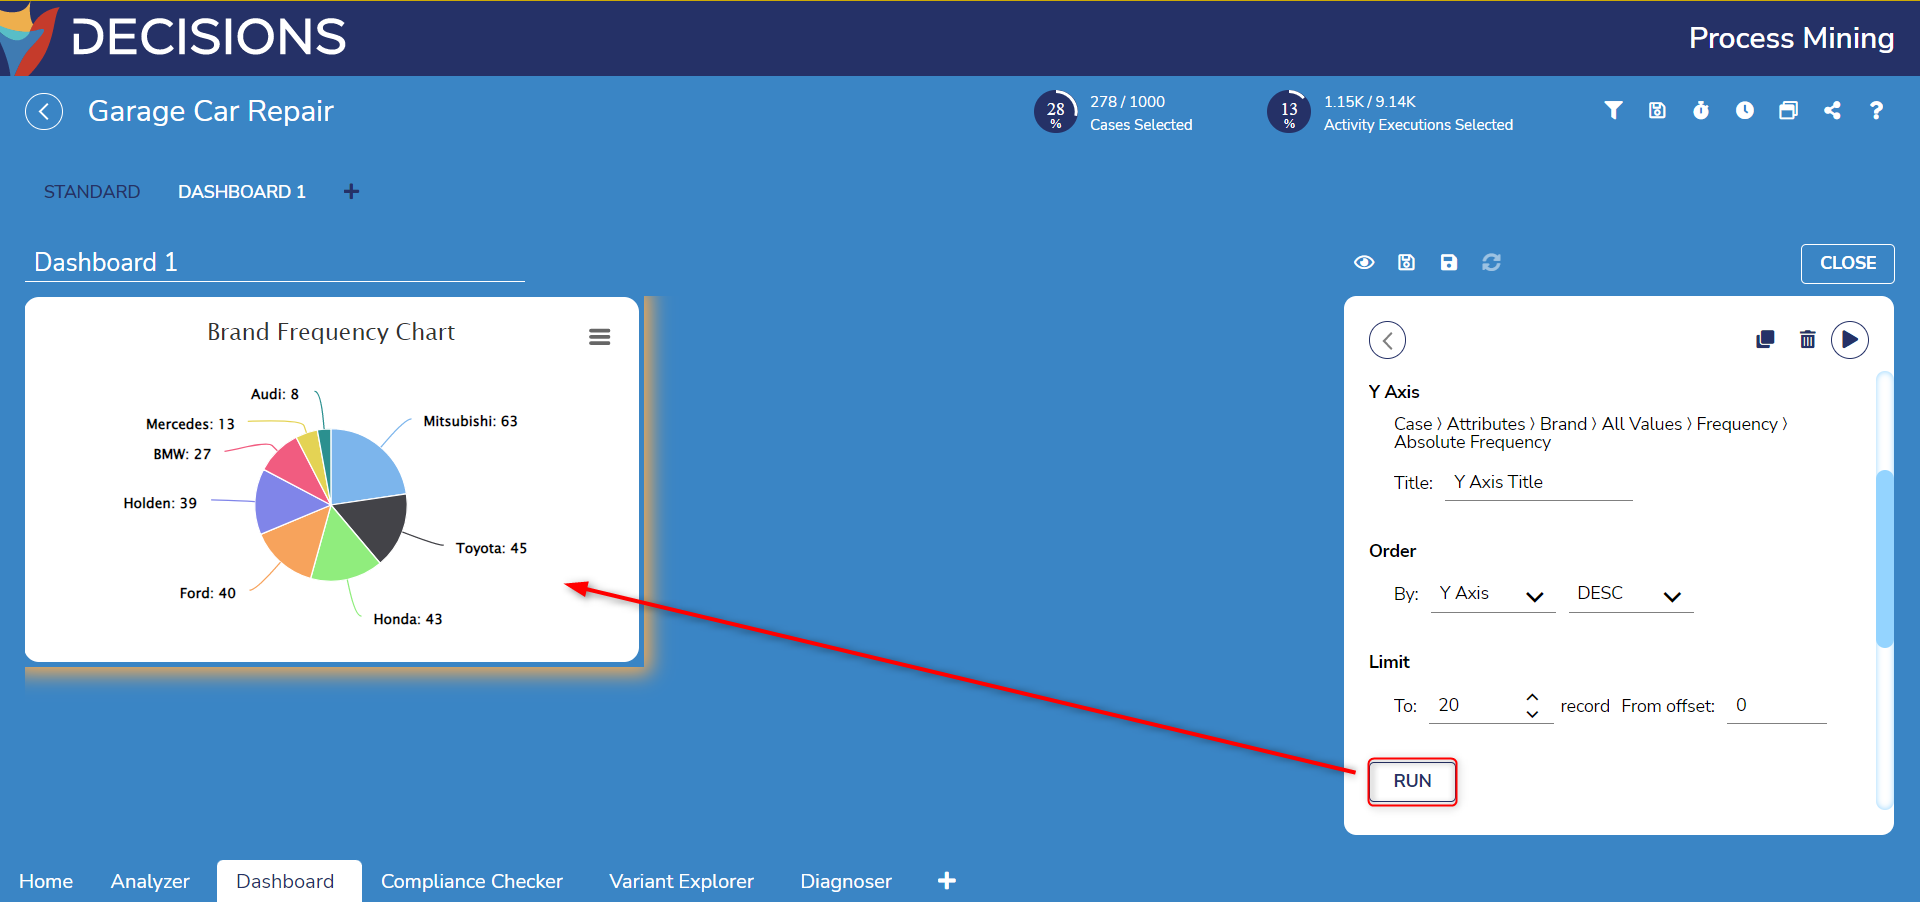
- For the Y Axis, click on Click to Select Data to open the Visual Query Builder again to select the dimension's KPI for the chart. This time, navigation is automatically set to All Values with two new options available: Frequency and Duration.
Select Frequency > Absolute Frequency to display frequency by count. Select OK to confirm.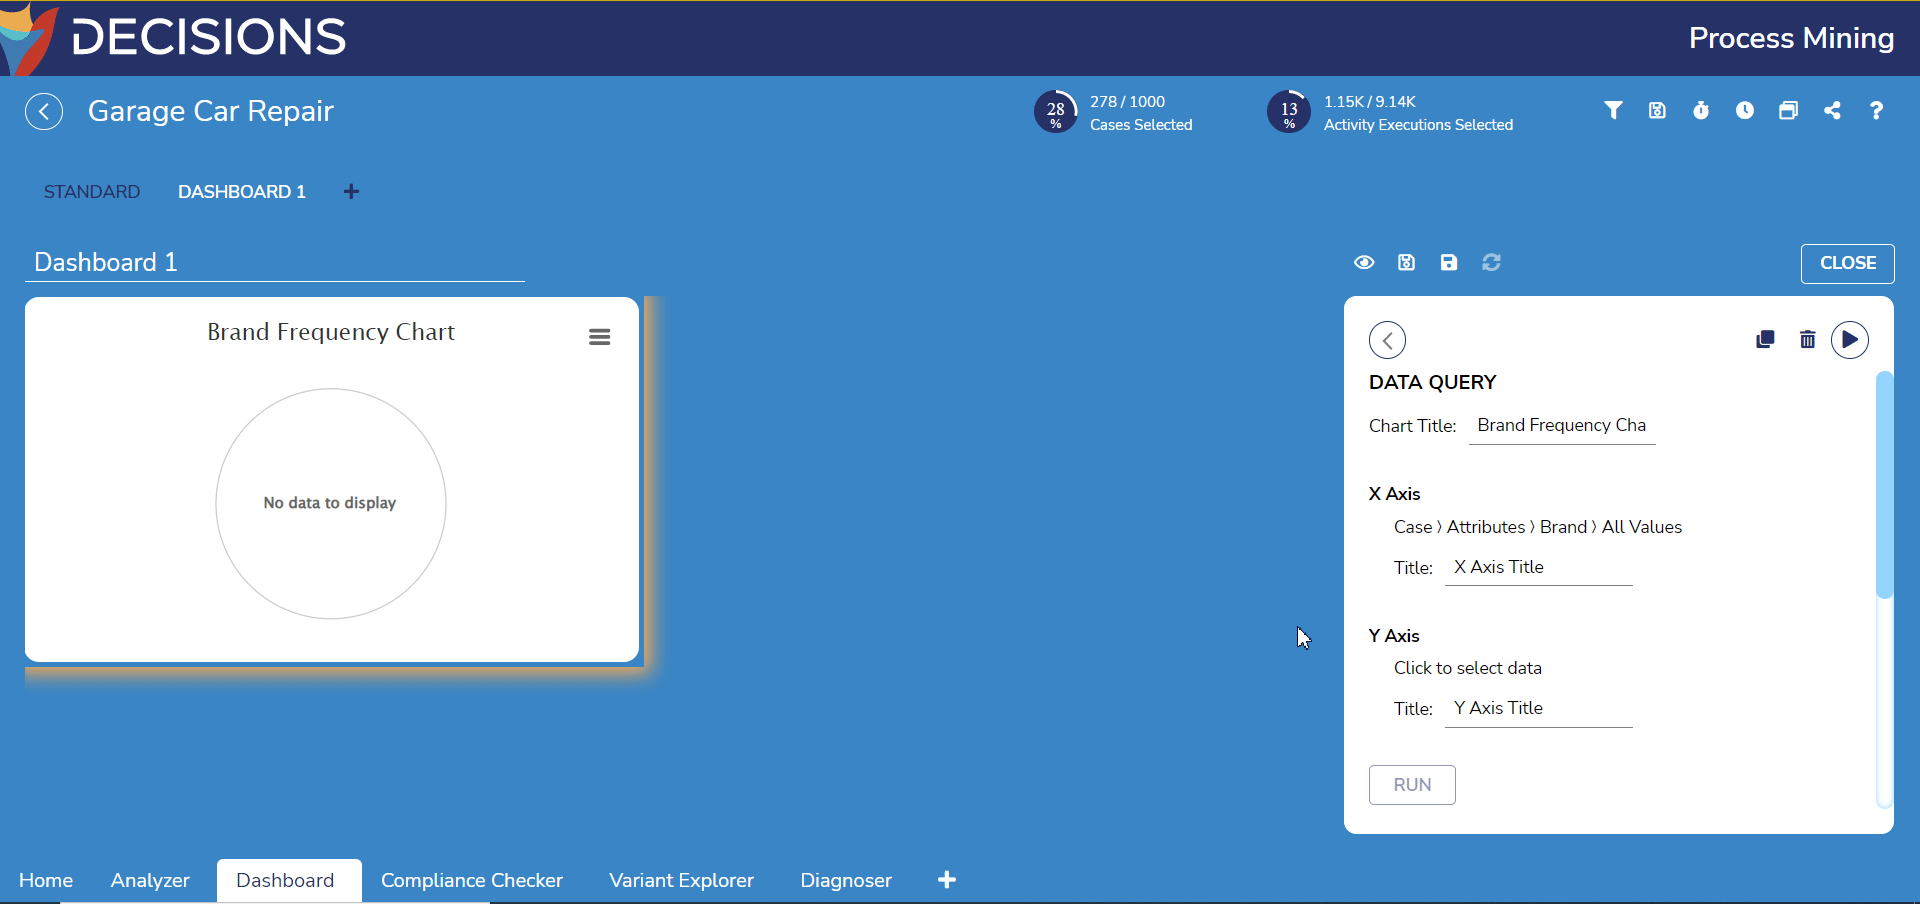
- Scroll down and select RUN to generate the chart based on its configuration.
- Deselect the chart by clicking on the empty workspace or click on the back arrow at the top left of the window to return to the Component Palette.
Drag Percentage Circle under the Scalar category. Like before, its settings will override the Component Palette.
- In the Percentage Circle's settings, select Click to Select Data to choose a KPI. This example will display the number of variants in all cases found via Case > # of Variants. Select OK to confirm.
- For the Show As dropdown menu, select % (Abs.) Scroll down to the Subtitle settings, select Static, and then enter 'Variant Count' in the new textbox. Select RUN to generate the percentage circle.
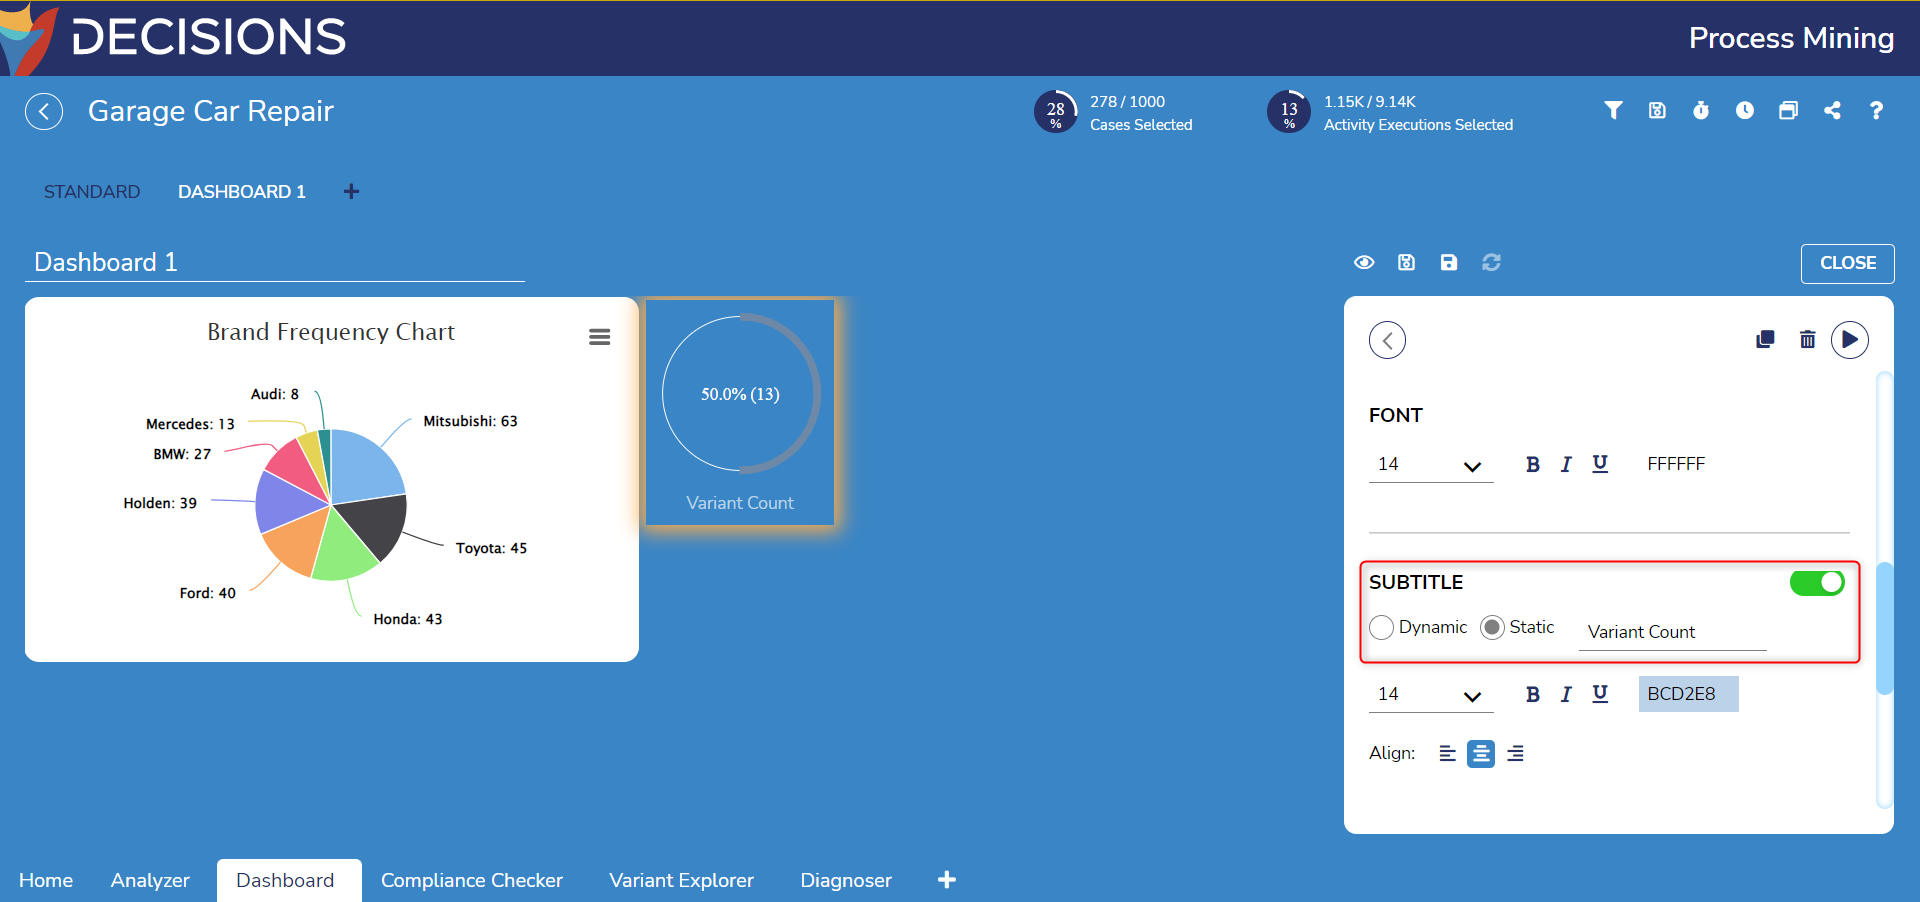
- In the Component Palette, drag a Vertical Separator from the Static Components category. Place it between the Pie Chart and the Percentage Circle.

- To preview the custom Process Dashboard, select the eye icon above the Component Palette. Reformatting toggle buttons Fit to Width and Center are available to alter the view.


Saving a Custom Process Dashboard
To save the Dashboard, select either of the two save icons above the Component Palette.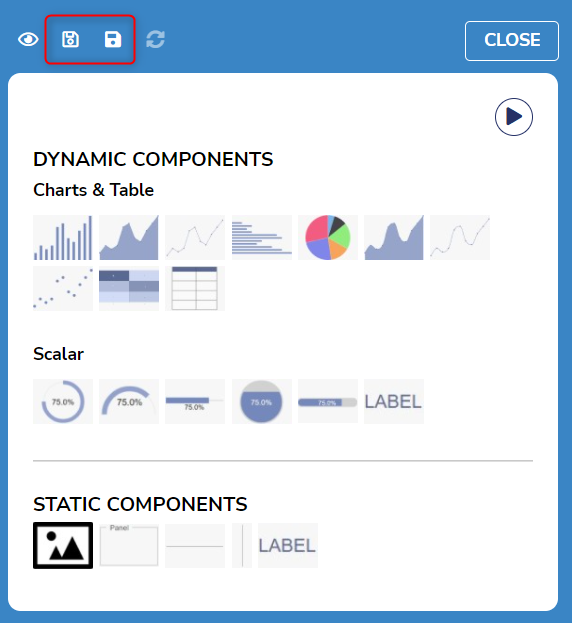
| Icon | Function |
|---|---|
| Outlined Save | Saves the filters currently in the Filter Log |
| Filled Save | Save the current filters as a new file in the Process Miner |
Updating a Custom Process Dashboard
When using one Custom Process Dashboard in multiple event logs' Dashboard tabs, it is a best practice to update the Custom Process Dashboard once viewing it to account for any edits.
- Select the CLOSE button to exit the default Edit mode.
- Select the cycling arrows icon to refresh the Dashboard and its components.
- A popup message occurs underneath the icon to confirm the Dashboard is now up-to-date.


Loading a Custom Process Dashboard
- Select the plus icon next to the Standard Dashboard tab.
- Select OPEN AN EXISTING DASHBOARD.
- Navigate to the Custom Process Dashboard file location in Process Mining via the Tree dropdown menu. After selecting the file, it will automatically open in a new tab.

Deleting a Custom Process Dashboard
- Select the CLOSE button to exit the default Edit mode.
- Select the trashcan icon to delete the Custom Process Dashboard.
- A confirmation window then pops up. To delete the Custom Process Dashboard's file in addition to it current tab, enable the Full Delete option. Regardless, select YES to confirm deletion.


Printing a Custom Process Dashboard
To print the Custom Process Dashboard, open the Dashboard in Preview Mode via the eye icon next to the save icons. Select the print icon.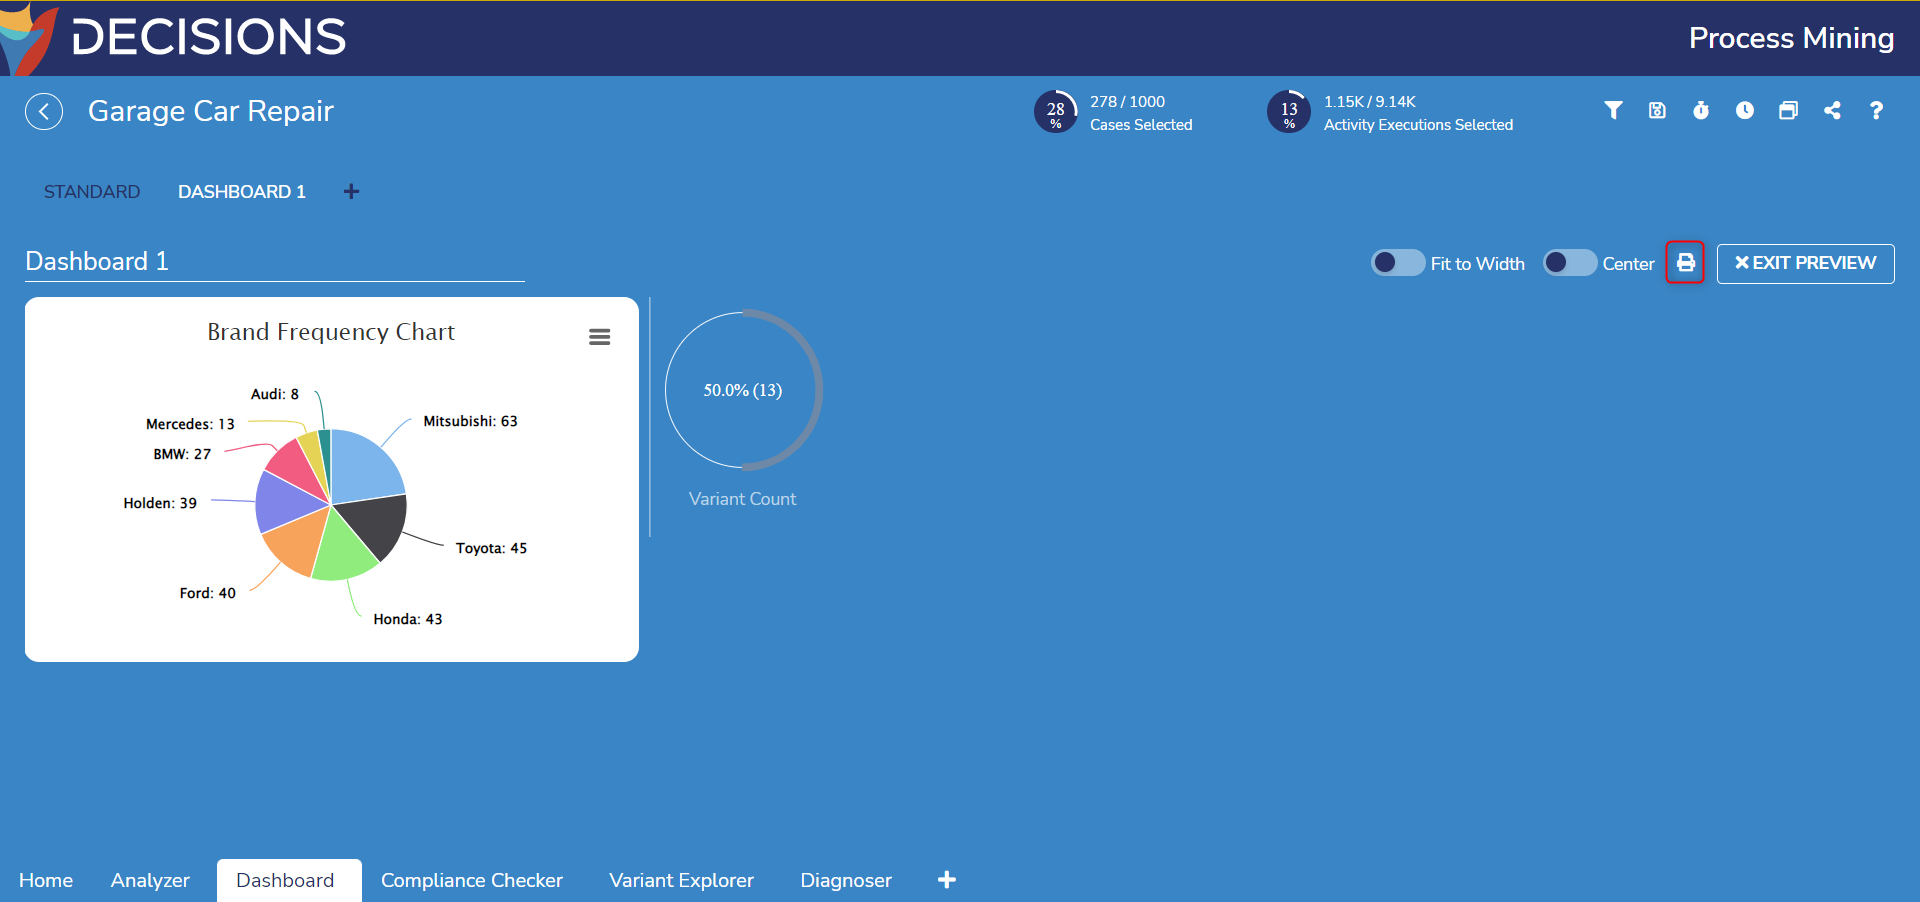
Alternatively, select CLOSE to exit the default Edit mode and then select the print icon there.
Was this article helpful?