Troubleshooting Designer Elements
- 26 May 2022
- 2 Minutes to read
-
Print
-
DarkLight
Troubleshooting Designer Elements
- Updated on 26 May 2022
- 2 Minutes to read
-
Print
-
DarkLight
Article Summary
Share feedback
Thanks for sharing your feedback!
This article provides troubleshooting steps, common causes, and resources when experiencing an error within Decisions.
For errors not resolved in this article, visit the Decisions forums and make a post so it may be solved by the Decisions community.
Alternatively, a support ticket can be submitted by contacting Decisions support via support@decisions.com.
Troubleshooting Checklist
When experiencing any errors, consult the following checklist to help determine their origin. Note that some of these suggestions require Administrator access.
Build Logic
Confirm if the error occurs in a similar Decisions Object by copying the suspected Object for testing.
For example, if a Flow with a Form is causing errors, isolate each Object in a sterile workflow to narrow down the error's location. Use the Debugger to verify all Flow logic/rule logic executes as intended. Check each step's inputs and outputs.Browser
Slow performance may be related to the browser. Try opening Decisions in a private browser window e.g. Chrome's Incognito mode and/or in a different supported browser.Machine
Try running the process outside of the machine's built-in firewall and on a different machine. This will isolate whether the error is originating from within the server, environment, platform, or is external.
Common potential issues that could occur between the client environment and the server involve latency issues, DNS records, encryption, etc.
Environments
If the error still persists, monitor the back-end environment behind Decisions i.e. the database, any service managers, and client machines for their server performance. Evaluate each for any standout issues that could affect the front-end.
Potential Causes for Performance Issues
Internal Issues
| Affected Feature | Potential Causes |
|---|---|
| Data Flows | Too many Flows running on startup. |
| External Content | Too much external content loading in such as data populating a large list, redirect loops, and slow External Systems. |
| Visibility Rules | Conflicting Visibility Rules in a Form interrupts rendering. |
| Development Issues | Errors or mistakes in development could cause issues like unclosed loops. |
| Older Decisions Versions | Potential bugs in legacy versions of Decisions. |
| Running Processes | Other running processes like Scheduled Jobs. |
| Improper Design | Improper Form/Flow design can be an incorrect use of Data Repeaters or incorrect logic in the Flow. |
| Static Content | Too much Static content. |
| Nested Containers | Containers nested too deeply. |
Outside Issues
| Affected Feature | Potential Causes |
|---|---|
| Network Issues | Network issues at the server site. |
| Browser Issues | Out of memory, browser extension issues, etc. |
| Skype | If Skype click-to-call is installed ( causes browser issues). |
| Cluster Issues | Problems with a Cluster or a Node within the Cluster. |
| DDoS Attack | Distributed denial-of-service attacks (Network issues). |
| IIS Issues | Problems occurring with Internet Information Services. |
Database Issues
| Affected Feature | Potential Causes |
|---|---|
| Storage | Running out of space on the Database. |
| Logs | Database Logs are full. |
| Long Queries | Long-running or complex queries can cause slowness trying to execute. |
| Bottlenecks | Too many interactions occurring with the Database at once. |
| Version | Wrong version of Database software. |
| Network Database | Issues that could occur with a Database or could be from network issues of the Database. |
Advanced Troubleshooting
The following built-in tools are available to supplement troubleshooting.
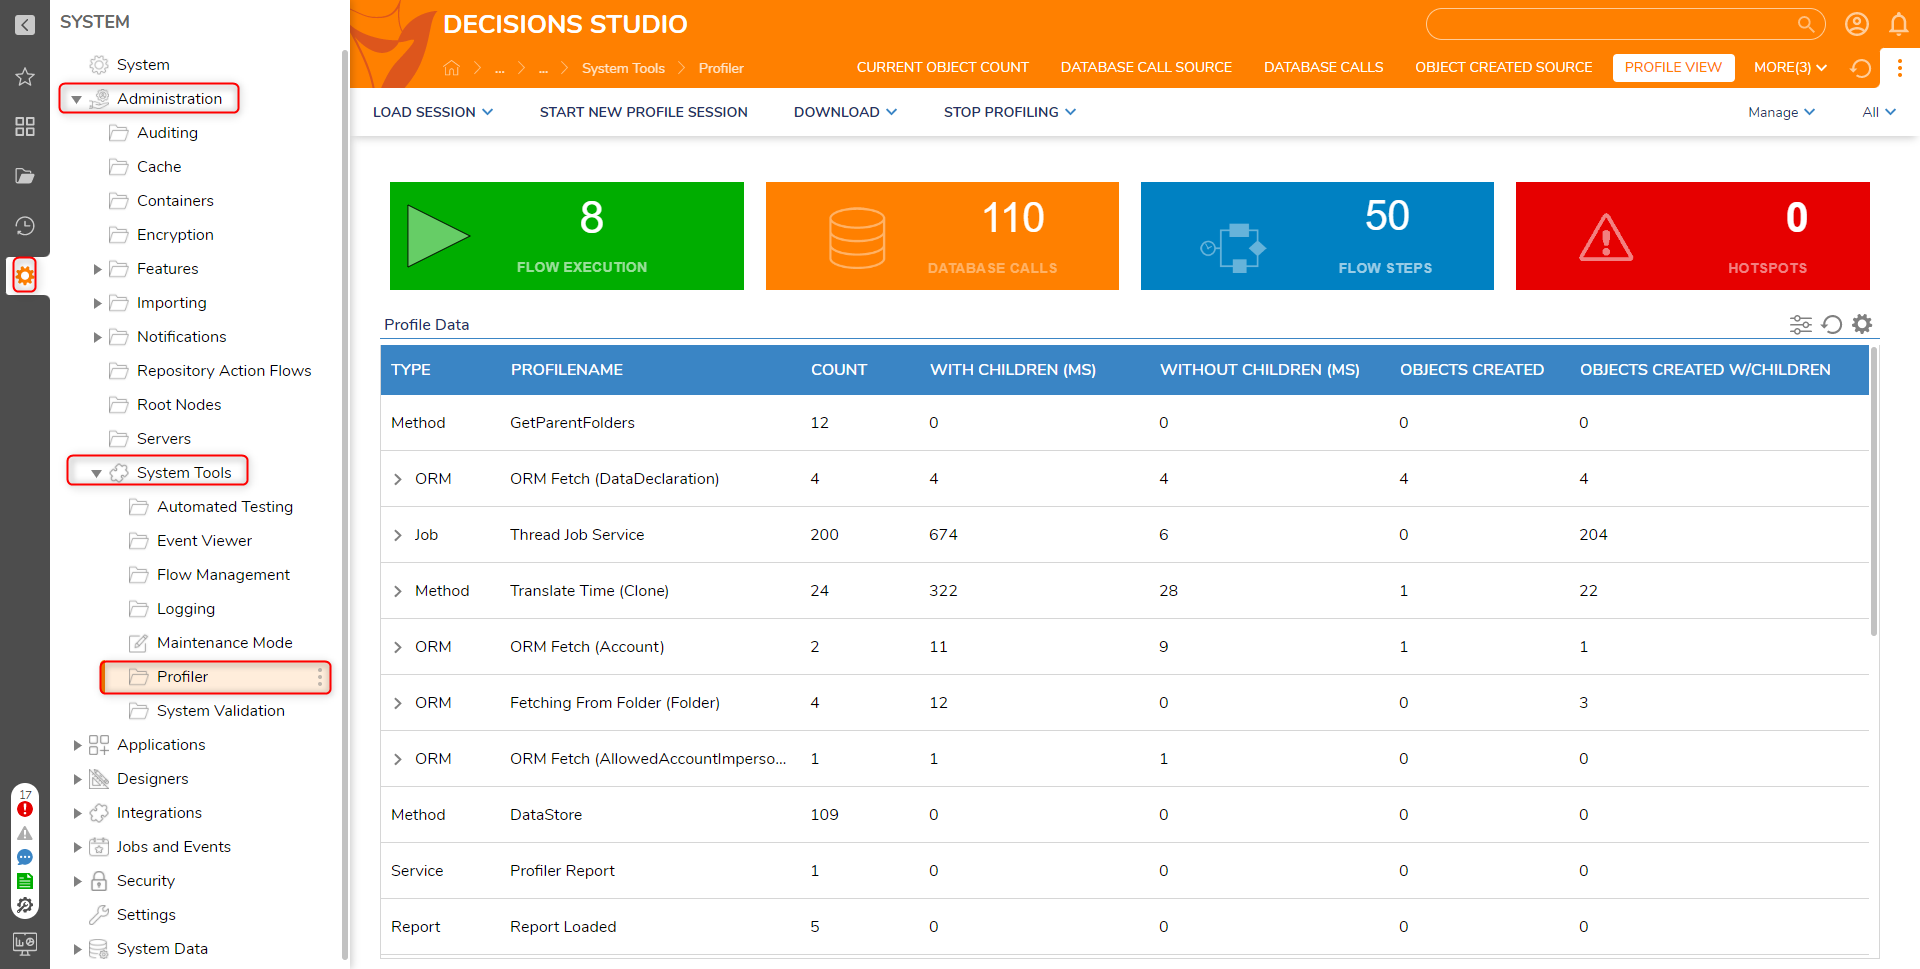
Profiler
Administrators may access the Profiler which captures data behind every step execution in every Flow in the instance. This data includes the count of executions and objects within the Flow as well as each step's completion time.
Browser Developer Tools
If available in the current browser, Developer Tools can help isolate performance issues within Decisions. Of its range of tools, two tabs are particularly notable references:
- Console - This tab displays logged messages of the actions completed on the webpage to the user. These messages vary from warnings to informational logs.
- Network - This tab displays how long it takes a selected element to connect to Decisions as well as the properties behind each individual resource. This helps determine if the error is environment-based.
For Chrome, Firefox, and Edge, Developer Tools are accessed by entering either CTRL+SHIFT+I or F12. For Safari users, open the Safari Develop menu in the menu bar.
Was this article helpful?