Server Performance Testing
- 25 Aug 2022
- 3 Minutes to read
- Print
- DarkLight
Server Performance Testing
- Updated on 25 Aug 2022
- 3 Minutes to read
- Print
- DarkLight
Article Summary
Share feedback
Thanks for sharing your feedback!
API Tests
The following section provides information on general server performance when a large volume of requests are being made to a Decisions environment. The number of active cores was limited for each test, providing a comparable value for performance load.
The total throughput is calculated by averaging the number of requests processed over a 5-minute interval from both servers. The results are then used to determine a rough estimate for the average throughput over an hour.
Testing Server Specifications
Below is a diagram setup used for testing. Three testing servers were used, with one containing Decisions and the remaining servers using JMeter to send requests to the Decisions environment. The three environments are located on the same network.
This setup is used for the Rule Engine and Flow API execution tests, and hardware-software specifications are included below.

| Server Name | Server Type | Operating System | Physical Memory | Processor | Core Count |
|---|---|---|---|---|---|
| Decisions | Decisions | Microsoft Windows Server 2019 Standard | 48 GB | Intel(R) Core(TM) i7-9700 CPU @ 3.00GHz | 8 Cores, 8 Logical Processors |
| JMeter Test 1 | JMeter | Microsoft Windows Server 2022 Standard | 32 GB | Intel(R) Core(TM) i9-9900K CPU @ 3.60GHz | 4 Cores, 8 Logical Processors |
| JMeter Test 2 | JMeter | Microsoft Windows Server 2019 Standard | 16 GB | Intel(R) Core(TM) i7-7700 CPU @ 3.60GHz | 4 Cores, 8 Logical Processors |
Rules
The following tests the performance of the Rule Engine, where a Rule was called multiple times as an API service.
Single Phrase Rule
A simple Rule was created for this test where two integer values were compared. Below is the average number of executions within the 5-minute interval.

| Core Number | Average Throughput/sec | Average Throughput/hour |
|---|---|---|
| 8 Cores | 16,490.7/s | 59,366,520/hr |
| 4 Cores | 11,983.6/s | 43,140,960/hr |
| 2 Cores | 6,786.8/s | 24,431,760/hr |
| 1 Core | 3,682.3/s | 13,256,280/hr |
Twenty Phrase Rule
For this test, a Rule was created with 20 conditions to simulate a complex Rule. The Rule accepts two integer values as an input and outputs either True or False.

| Core Number | Average Throughput/sec | Average Throughput/hour |
|---|---|---|
| 8 Cores | 16,444.3/s | 59,199,480/hr |
| 4 Cores | 12,345/s | 44,442,000/hr |
| 2 Cores | 6,770.4/s | 24,373,440/hr |
| 1 Core | 3,688.7/s | 13,279,320/hr |
Flows
Four scenarios were used to test performance when a Flow is called an API Service. These methods represent how steps calling the database and the number of steps can affect the average throughput for a process.
Empty Flow
This test case contains a Flow with only the Start and End steps connected.

| Core Number | Average Throughput/sec | Average Throughput/hour |
|---|---|---|
| 8 Cores | 15,015.6/s | 54,056,160/hr |
| 4 Cores | 10,469.4/s | 37,689,840/hr |
| 2 Cores | 5,492/s | 19,771,200/hr |
| 1 Cores | 2,897.3/s | 10,430,280/hr |
Ten Step Flow
This test case contains a Flow that has 10 Add steps along with accepting a numerical input.

| Core Number | Average Throughput/sec | Average Throughput/hour |
|---|---|---|
| 8 Cores | 12,721.4/s | 45,797,040/hr |
| 4 Cores | 7,705.6/s | 27,740,160/hr |
| 2 Cores | 4,002.7/s | 14,409,720/hr |
| 1 Cores | 2,168.5/s | 7,806,600/hr |
DB Step Flow
The following test case uses a preconfigured step that queries the database and returns a result. The table contained 10,000 records.

| Core Number | Average Throughput/sec | Average Throughput/hour |
|---|---|---|
| 8 Cores | 48.24/s | 173,664/hr |
| 4 Cores | 30.5/s | 109,800/hr |
| 2 Cores | 17/s | 61,200/hr |
| 1 Cores | 8.9/s | 32,040/hr |
Cached DB Step Flow
The following test case uses the same step from the previous use case but instead utilizes the cache. The cache was configured to record outcomes on a per user basis and to remain available for 30 minutes.

| Core Number | Average Throughput/sec | Average Throughput/hour |
|---|---|---|
| 8 Cores | 90.5/s | 325,800/hr |
| 4 Cores | 87.2/s | 313,920/hr |
| 2 Cores | 86.9/s | 312,840/hr |
| 1 Cores | 70.7/s | 254,520/hr |
Database Integration Latency Tests
The following section covers the average execution time between Decisions and a database. Included with the test was a connection table integration to a remote SQL database. Two scenarios were used, one representing a low latency configuration and another depicting a high latency configuration.
These tests use a Flow that contains either the Insert, Update, Bulk Insert, and Get by ID(Email) steps. The Flow is iterated a set number of times, with the start and end times recorded and used to determine the total execution time of the process.
Below is the specification for the SQL Server databases used for this test.
| Server Name | SQL Server Version | Windows Version | DB Size | Space Available |
|---|---|---|---|---|
| Decisions Server | SQL Server Management Studio - 15.0.18384 | 10.0.17763 | 10064.00 MB | 2312.03 MB |
| Remote SQL Database | SQL Server Management Studio - 15.0.18380 | 10.0.20348 | 3024.00 MB | 1987.84 MB |
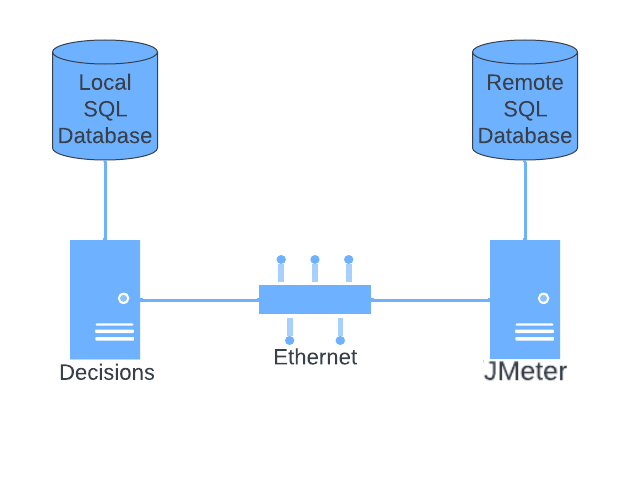
Low Latency Environment Setup
The following diagram represents the environment configuration used to test a low latency environment. Connections between the Decisions Server and a remote database server are established over an ethernet connection to the same network.
Low Latency Results (Local)
Insert
| Total Count of Rows | Start Time | End Time | Total Execution Time |
|---|---|---|---|
| 100 | 11:57:31 | 11:57:31 | 0:00:00 |
| 1000 | 12:48:53 | 12:48:54 | 0:00:01 |
| 10000 | 12:49:41 | 12:49:49 | 0:00:08 |
| 100000 | 12:50:26 | 12:51:54 | 0:01:28 |
| 1000000 | 1:01:25 | 1:15:39 | 0:14:14 |
Update
| Total Count of Rows | Start Time | End Time | Total Execution Time |
|---|---|---|---|
| 100 | 7:01:01 | 7:01:01 | 0:00:00 |
| 1000 | 7:01:43 | 7:01:44 | 0:00:01 |
| 10000 | 7:02:51 | 7:03:00 | 0:00:09 |
| 100000 | 7:08:30 | 7:10:09 | 0:01:39 |
| 1000000 | 7:34:06 | 7:50:49 | 0:16:43 |
Bulk Insert
| Total Count of Rows | Start Time | End Time | Total Execution Time |
|---|---|---|---|
| 100 | 1:41:17 | 1:41:17 | 0:00:00 |
| 1000 | 1:42:02 | 1:42:02 | 0:00:00 |
| 10000 | 1:43:06 | 1:43:06 | 0:00:00 |
| 100000 | 1:43:42 | 1:43:43 | 0:00:01 |
| 1000000 | 1:44:21 | 1:44:37 | 0:00:16 |
Get by ID (Email)
| Total Count of Rows | Start Time | End Time | Total Execution Time |
|---|---|---|---|
| 100 | 1:54:02 | 1:54:02 | 0:00:00 |
| 1000 | 1:54:38 | 1:54:38 | 0:00:00 |
| 10000 | 1:55:23 | 1:55:23 | 0:00:00 |
| 100000 | 1:55:58 | 1:55:59 | 0:00:01 |
| 1000000 | 1:55:18 | 1:53:25 | 0:00:07 |
Low Latency Results (Remote)
Insert
| Total Count of Rows | Start Time | End Time | Total Execution Time |
|---|---|---|---|
| 100 | 11:51:34 | 11:51:34 | 0:00:00 |
| 1000 | 11:55:10 | 11:55:11 | 0:00:01 |
| 10000 | 11:56:54 | 11:57:03 | 0:00:09 |
| 100000 | 11:58:40 | 12:00:13 | 0:01:33 |
| 1000000 | 12:24:34 | 12:39:21 | 0:14:47 |
Update
| Total Count of Rows in the Database | Start Time | End Time | Total Execution Time |
|---|---|---|---|
| 100 | 11:53:32 | 11:53:32 | 0:00:00 |
| 1000 | 11:55:46 | 11:55:47 | 0:00:00 |
| 10000 | 11:57:37 | 11:57:48 | 0:00:00 |
| 100000 | 12:18:35 | 12:12:13 | 0:00:02 |
| 1000000 | 12:58:37 | 13:15:30 | 0:00:17 |
Bulk Insert
| Total Count of Rows in the Database | Start Time | End Time | Total Execution Time |
|---|---|---|---|
| 100 | 12:51:12 | 12:51:12 | 0:00:00 |
| 1000 | 12:56:40 | 12:56:40 | 0:00:00 |
| 10000 | 12:58:27 | 12:58:27 | 0:00:00 |
| 100000 | 12:59:53 | 12:59:55 | 0:00:02 |
| 1000000 | 1:01:24 | 1:01:41 | 0:00:17 |
Get by ID (Email)
| Total Count of Rows in the Database | Start Time | End Time | Total Execution Time |
|---|---|---|---|
| 100 | 12:55:58 | 12:55:58 | 0:00:00 |
| 1000 | 12:57:05 | 12:57:05 | 0:00:00 |
| 10000 | 12:58:41 | 12:58:41 | 0:00:00 |
| 100000 | 1:00:19 | 1:00:19 | 0:00:00 |
| 1000000 | 1:02:11 | 1:02:17 | 0:00:06 |
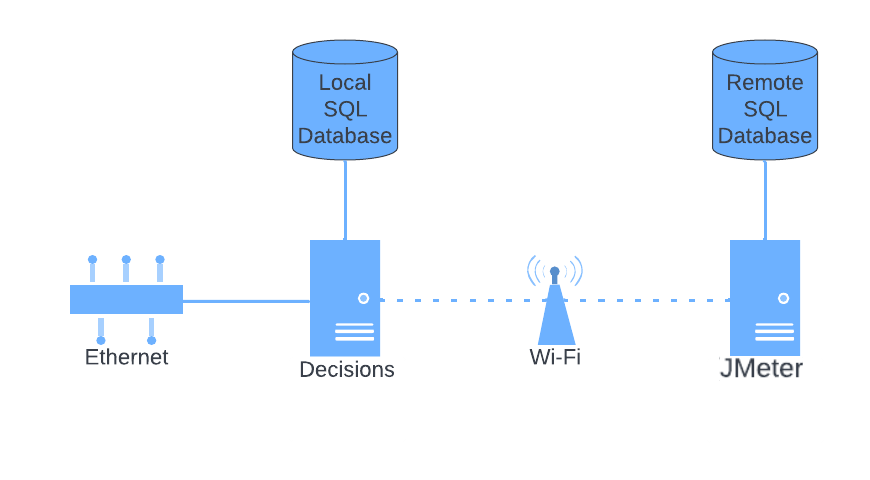
High Latency Environment Setup
For this scenario, the connection between the Decisions server and remote SQL database is established wirelessly. This was used to simulate having the remote database in a separate physical location.
High Latency Results
Insert
| Total Count of Rows | Start Time | End Time | Total Execution Time |
|---|---|---|---|
| 100 | 1:05:56 | 1:05:57 | 0:00:01 |
| 1000 | 1:07:42 | 1:07:43 | 0:00:01 |
| 10000 | 1:08:57 | 1:09:11 | 0:00:14 |
| 100000 | 1:14:39 | 1:16:20 | 0:01:41 |
| 1000000 | 1:20:04 | 1:37:30 | 0:17:26 |
Update
| Total Count of Rows | Start Time | End Time | Total Execution Time |
|---|---|---|---|
| 100 | 1:07:00 | 1:07:00 | 0:00:00 |
| 1000 | 1:08:16 | 1:08:17 | 0:00:01 |
| 10000 | 1:10:41 | 1:10:56 | 0:00:15 |
| 100000 | 1:17:07 | 1:18:56 | 0:01:49 |
| 1000000 | 1:38:53 | 1:57:40 | 0:18:47 |
Bulk Insert
| Total Count of Rows | Start Time | End Time | Total Execution Time |
|---|---|---|---|
| 100 | 2:00:35 | 2:00:35 | 0:00:00 |
| 1000 | 2:01:50 | 2:01:51 | 0:00:01 |
| 10000 | 2:02:59 | 2:02:59 | 0:00:00 |
| 100000 | 2:04:10 | 2:04:11 | 0:00:01 |
| 1000000 | 2:05:35 | 2:05:51 | 0:00:16 |
Get by ID (Email)
| Total Count of Rows | Start Time | End Time | Total Execution Time |
|---|---|---|---|
| 100 | 2:01:00 | 2:01:01 | 0:00:01 |
| 1000 | 2:02:12 | 2:02:12 | 0:00:00 |
| 10000 | 2:03:05 | 2:03:05 | 0:00:00 |
| 100000 | 2:04:15 | 2:04:16 | 0:00:01 |
| 1000000 | 2:06:00 | 2:06:07 | 0:00:007 |
Was this article helpful?