Overview
The SPC Analyzer generates SPC (Statistical Process Control) charts to study the effect of process changes over time organized chronologically.
Implementing the SPC Analyzer in a user's routine process performance analysis may uncover variations, highlight inefficient areas in the process worth investigating, and predict future data trends to inform proactive responses to potential upcoming roadblocks.
It is a best practice to use SPC charts in small areas of the process first before capturing larger sections let alone the entire process.
Users may create either Attribute SPC Charts to focus on a specific attribute's changes to spot variants or Complex Condition SPC Charts to group data points charted via rules by switching the toggle button atop the chart settings.
SPC Chart Breakdown
An SPC chart comprises of the following parts:
| Chart Part | Function |
|---|---|
| Points (i.e. measurements) | Represents a statistic e.g. a mean, range, proportion, of measurements of a quality characteristic in samples taken from the process at different times |
| Central Line (CL) | Represents the mean value of the statistic |
| Lower Control Limit (LCL) | Represents the lower threshold at which process output is considered statistically unlikely. Usually drawn at three standard deviations below the center line |
| Upper Control Limit (UCL) | Represents the upper threshold at which process output is considered statistically unlikely. Usually drawn at three standard deviations above the center line |
The following screenshot demonstrates how these parts are represented on an example Attribute SPC Chart. Notice the legend at the bottom of the chart.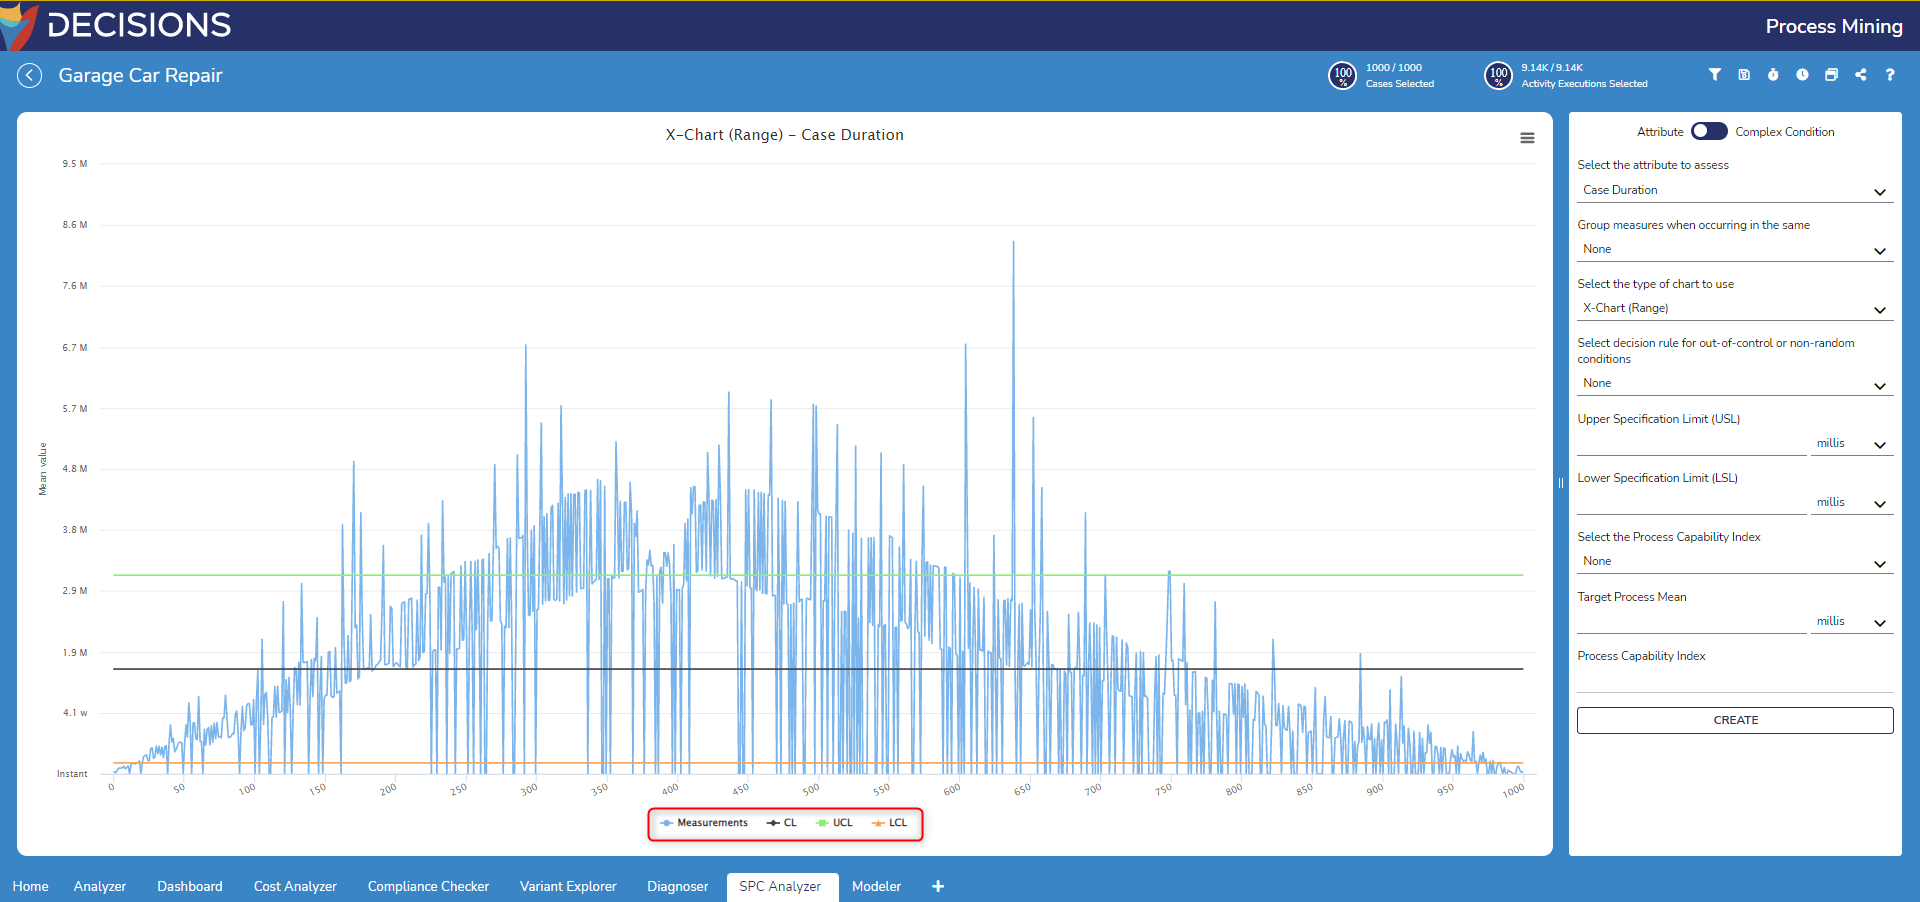
Process Capability Indices
If the process is in control and the process statistic is normal, 99.7300% of all the points will fall between the control limits. Any observations outside the limits or systematic patterns within suggest a new, likely unanticipated variation known as a special-cause variation.
Since increased variation means increased quality costs, a control chart signaling the presence of a special-cause require immediate investigation.
In the context of process improvement efforts, the ability of processes in a state of statistical control to produce output within the specified limits is known as the process capability index.
Process capability indices measure how much natural variation a process experiences relative to its specification limits, and it allows different processes to be compared with respect to how well an organization controls them.
The process capability index is computed based on the USL and LSL as well as the target process mean. Available process capability indices within the SPC Analyzer include:
| Available Process Capability Indices | Function |
|---|---|
| Cp | Estimates what the process is capable of producing if the process mean were to be centered between the USL and LSL. Assumes process output is approximately normally distributed. |
| Cp, lower | Estimates process capability for specifications that consist of a lower limit only. Assumes process output is normally distributed. |
| Cp, upper | Estimates process capability for specifications that consist of a upper limit only. Assumes process output is normally distributed. |
| Cpk | Estimates what the process is capable of producing, considering the process mean may not be centered between the USL and LSL. Assumes process output is normally distributed. |
| Cpm | Estimates process capability around the target process mean. Assumes process output is approximately normally distributed. |
| Cpkm | Estimates process capability around target process mean and accounts for an off-center process mean. Assumes process output is normally distributed. |
Below you can find a quick reference table that based on the sigma level reports the percentage of the process meeting the requirements, and the Cp/Cpk index
| Sigma Level | Percentage of Process Meeting Requirements | Cp/Cpk Index |
|---|---|---|
| +/- 1 sigma | 68.2689480% | 0.33 |
| +/- 2 sigma | 95.4499875% | 0.67 |
| +/- 3 sigma | 99.7300065% | 1.00 |
| +/- 4 sigma | 99.9936627% | 1.33 |
| +/- 5 sigma | 99.9999425% | 1.67 |
| +/- 6 sigma | 99.9999998% | 2.00 |