Overview
The content in a Report Viewer can be summarized in a variety of View Modes. Such methods allows the ability to highlight data as a hierarchy, in Chart format, as Tiles, a List, and more.
The act of establishing a view method is referred to as selecting a Data Drill View. The following document demonstrates how to select a customize the Data Drill View on a Page via the Report Viewer component.
Example
- To begin, navigate to a Designer Project and CREATE a new Page.
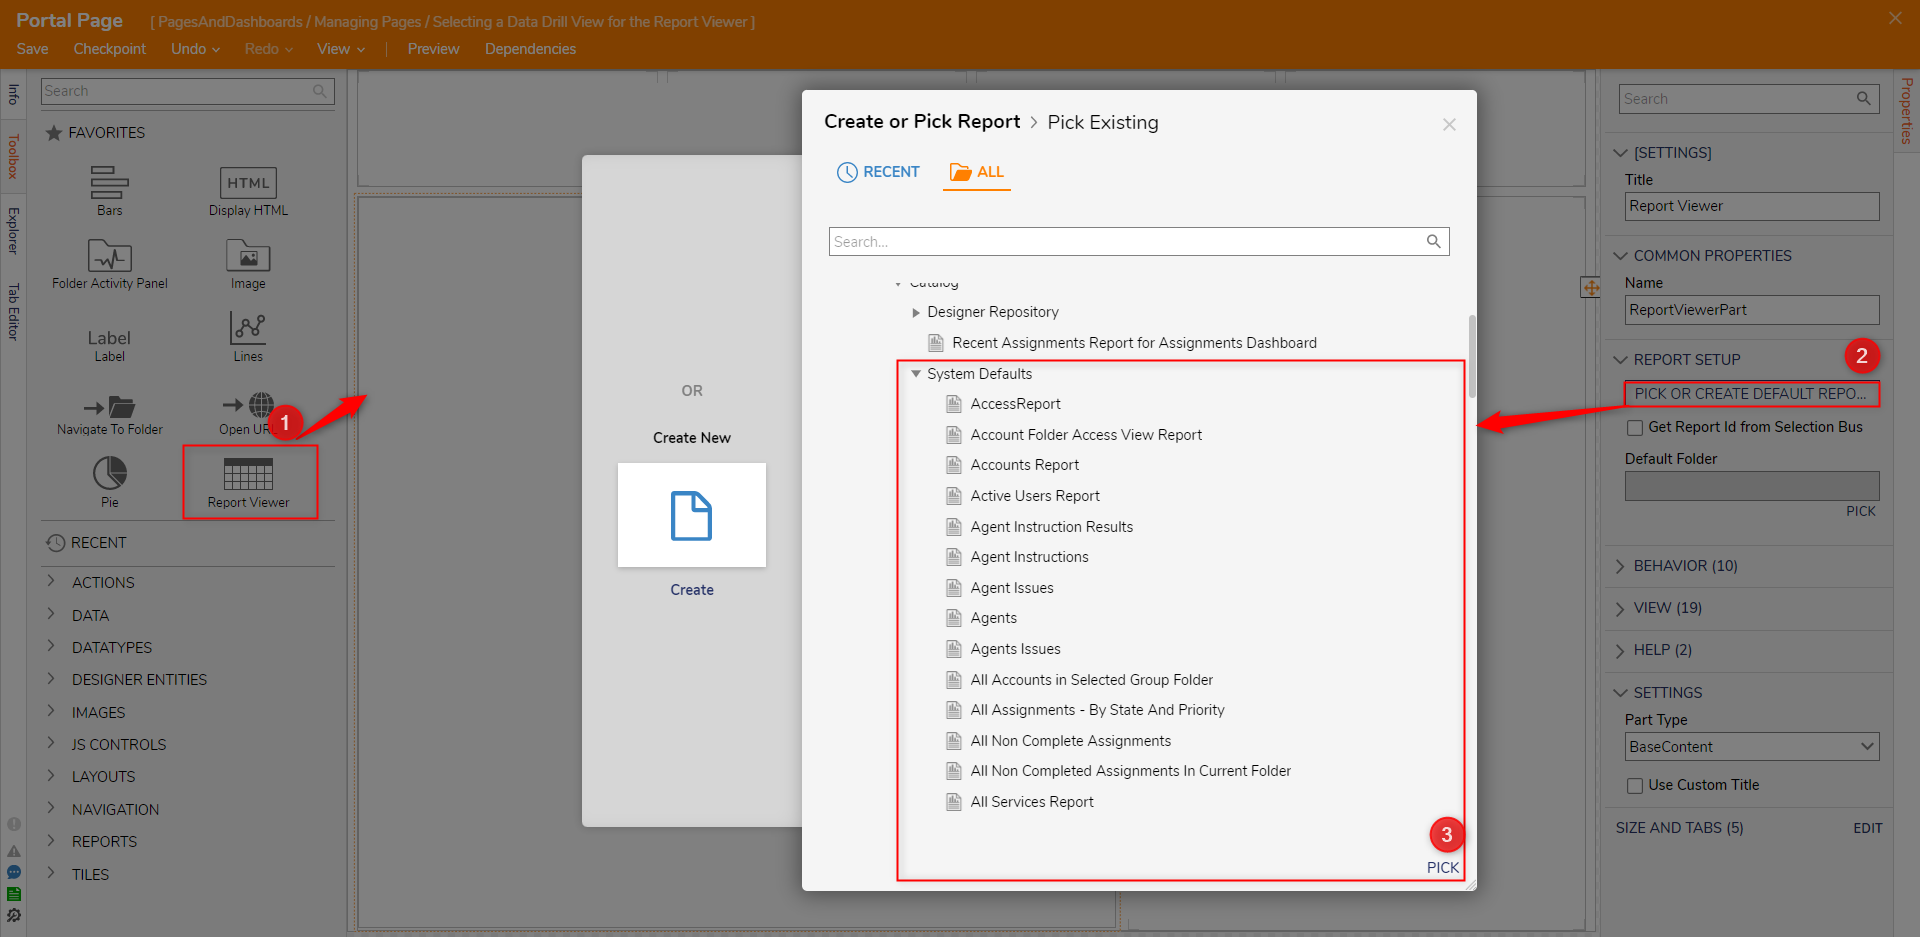
- From the Page Designer, add a Report Viewer from Toolbox > FAVORITES to the workspace.
- From the Toolbox, expand the Reports category and drag a Report Viewer component into the workspace.
- From the Properties tab of the Report Viewer, under REPORT SETUP, click PICK OR CREATE DEFAULT REPORT, then PICK one of the Reports under ALL > System > Designers > Catalog > System Defaults.

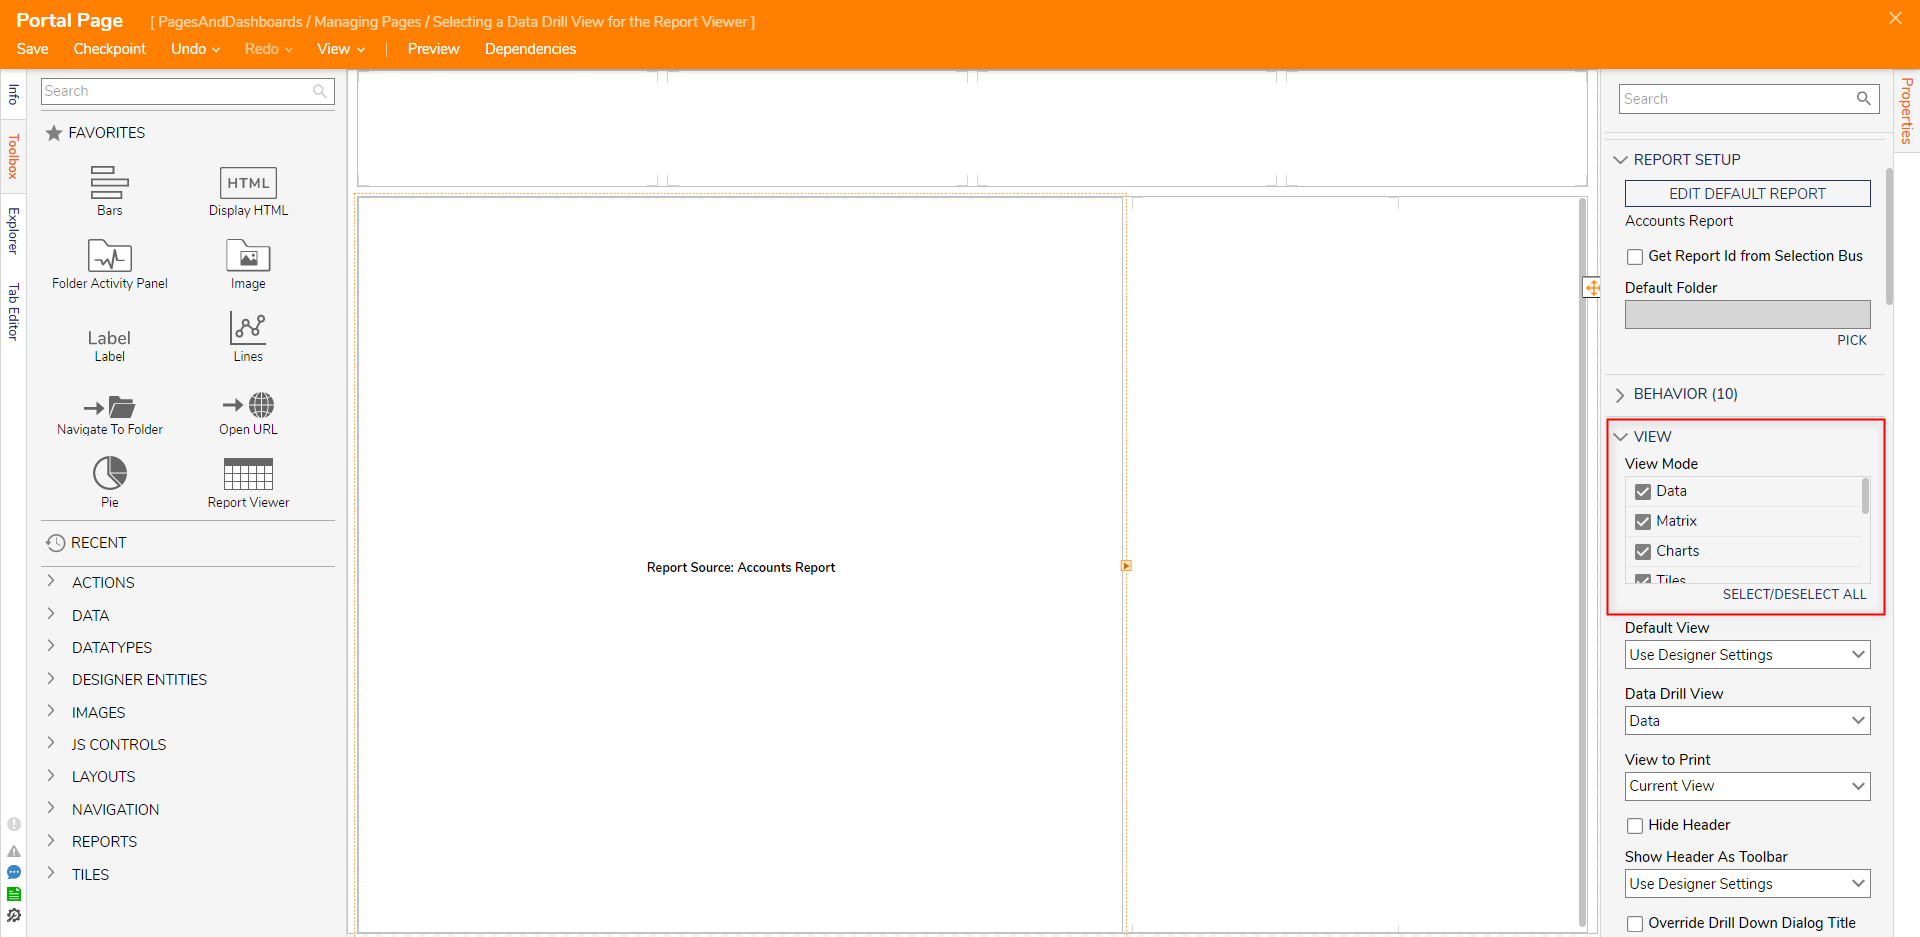
- From the Properties of the Report Viewer, navigate to VIEW > View Mode and enable/disable the desired output method. Report PrerequisitesTo use the Calendar, Charts, and Matrix options, the selected Report must be configured with those options by having the applicable option added in the Report Designer under Views.

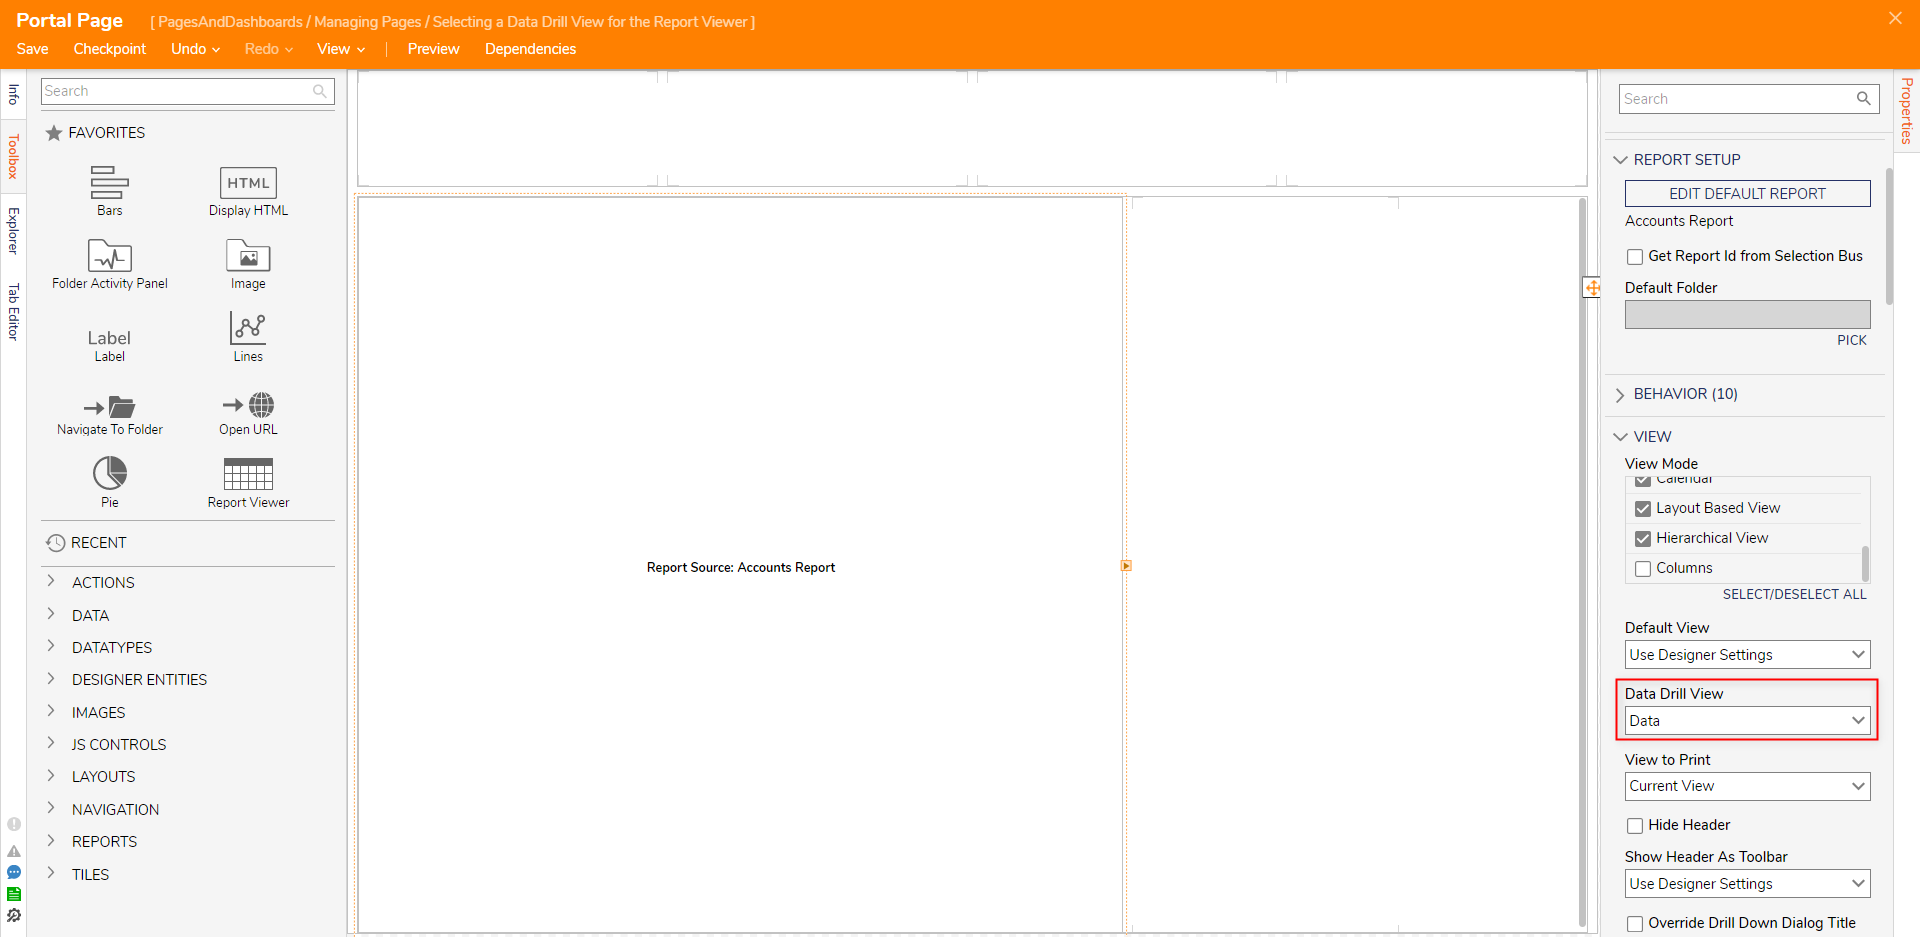
Under VIEW > Data Drill View, select the desired type from the drop-down; either Data, Rich Text, or Text List. Then, Save and close the Page.

Right-click the Designer Project, select Add Page/Dashboard and PICK the previously created Page. Then, navigate to the Page.
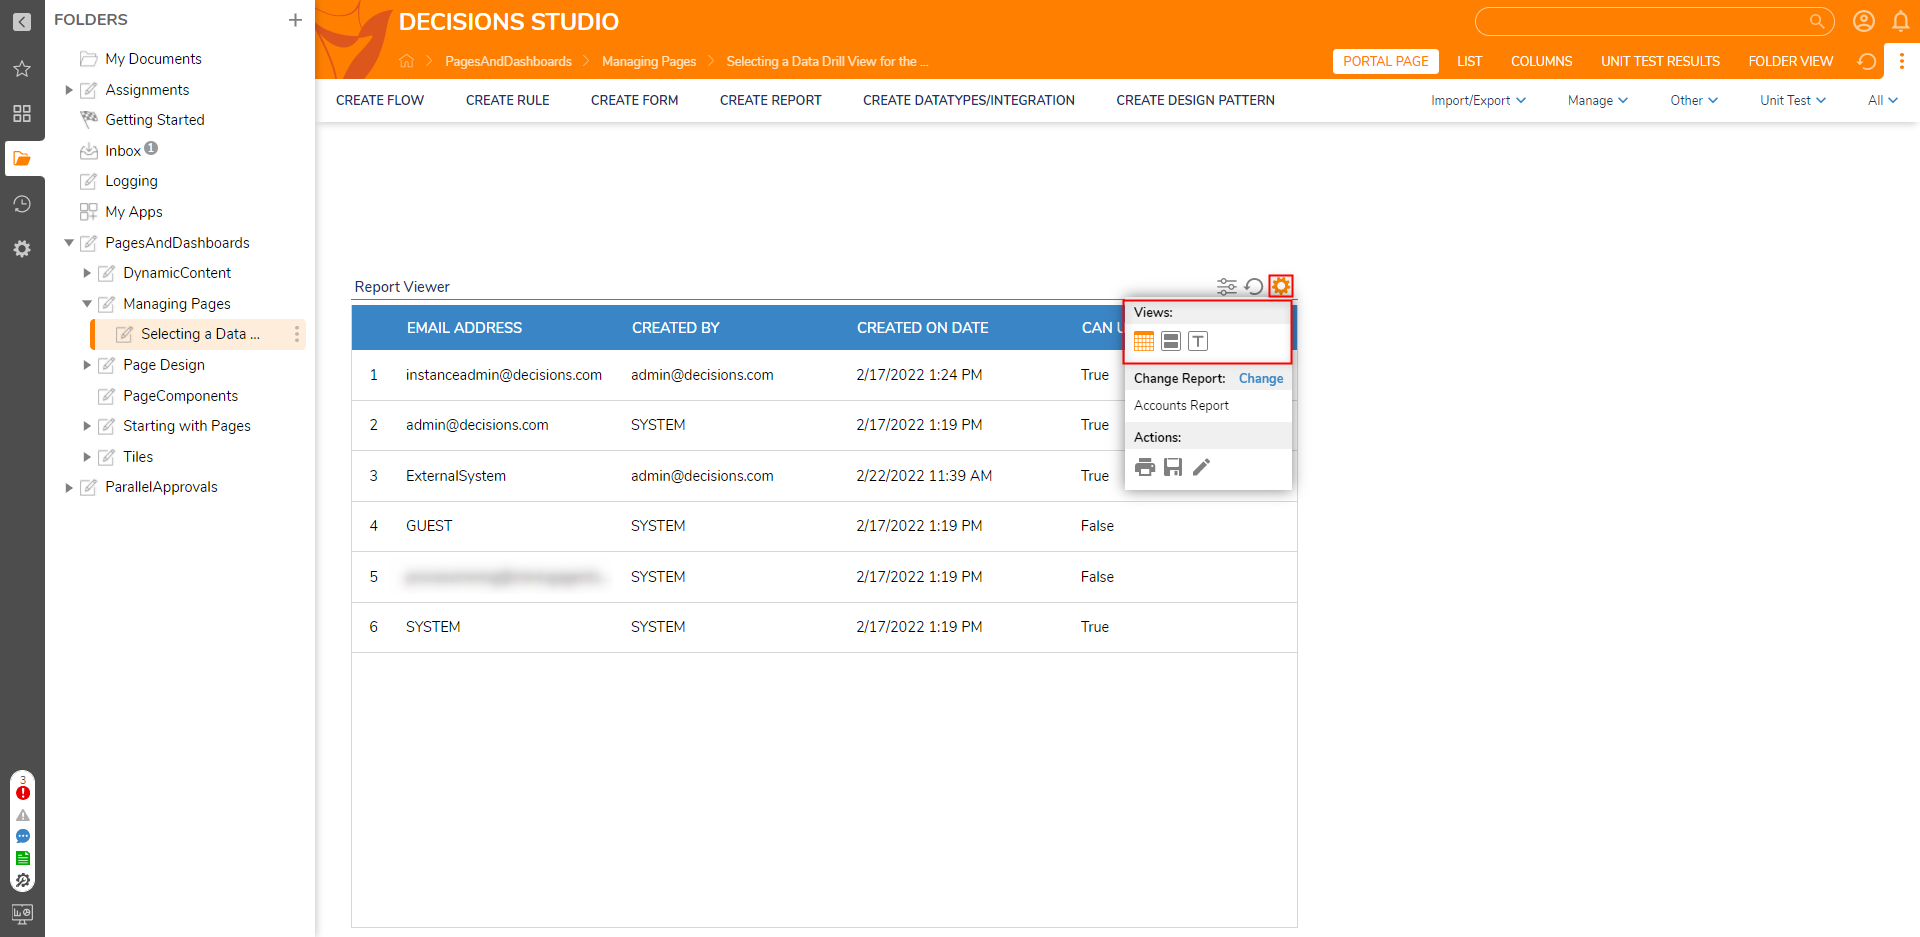
Select the Properties (gear icon) button from the Page and select the desired View Mode option under Views.

Navigating to the View Mode that matches the respective Data Drill View option will allow the ability to select an Item on the Report Viewer to view the individual Data Drill View for its respective data.
