Overview
The Impact Analyzer of the Diagnoser visualizes the relationship between a chosen attribute and a target outcome.
Frequency between an attribute and the target outcome is denote by connection width: wider connections denote higher frequency and vice versa.
An example use of the Impact Analyzer may involve a car repair garage servicing different brand of cars i.e. the attribute. The 'Brand' attribute may be compared against the 'Case Duration' outcome to uncover trends such as the majority of cases with Audi brand cars were completed quickly compared to the average case duration.
Configuration
The following settings are available for users to customize the Impact Analyzer. These are located in the column to the right of the diagram.
| Setting Location | Setting Name | Function |
|---|---|---|
| Input Attribute | Inspect impact of: | Allows selection of attribute within the event log. Only accepts single selection. |
| Intermediate Metric | Intermediate Metric | Toggles appearance of a second attribute to appear in the middle of the diagram named the intermediate attribute. Intermediate metrics filter the attributes' paths as either a Boolean or by entries of the selected intermediate attribute. For example, a 'Color' intermediate metric will gather attributes that are red, white, etc and then branch from there into the cases' outcomes. |
| Select metric: | Allows selection of which attribute within the event log will be the intermediate metric. Only accepts single selection. | |
| Outcome | Select outcome: | Allows selection of outcome to examine between the following options: Case Duration, Case Length, and Case Waiting Time. |
| Use groups | Toggles groups of the selected attribute's values | |
| Group values in X groups | Prompts for number of groups to to create for the selected attribute if groups are enabled. | |
| Group [Name]...includes up to [#] | Prompts for details of group including its name and its maximum value of its members. If Duration or Waiting Time is selected, then this settings also prompts for a unit of time e.g. month. |
Example
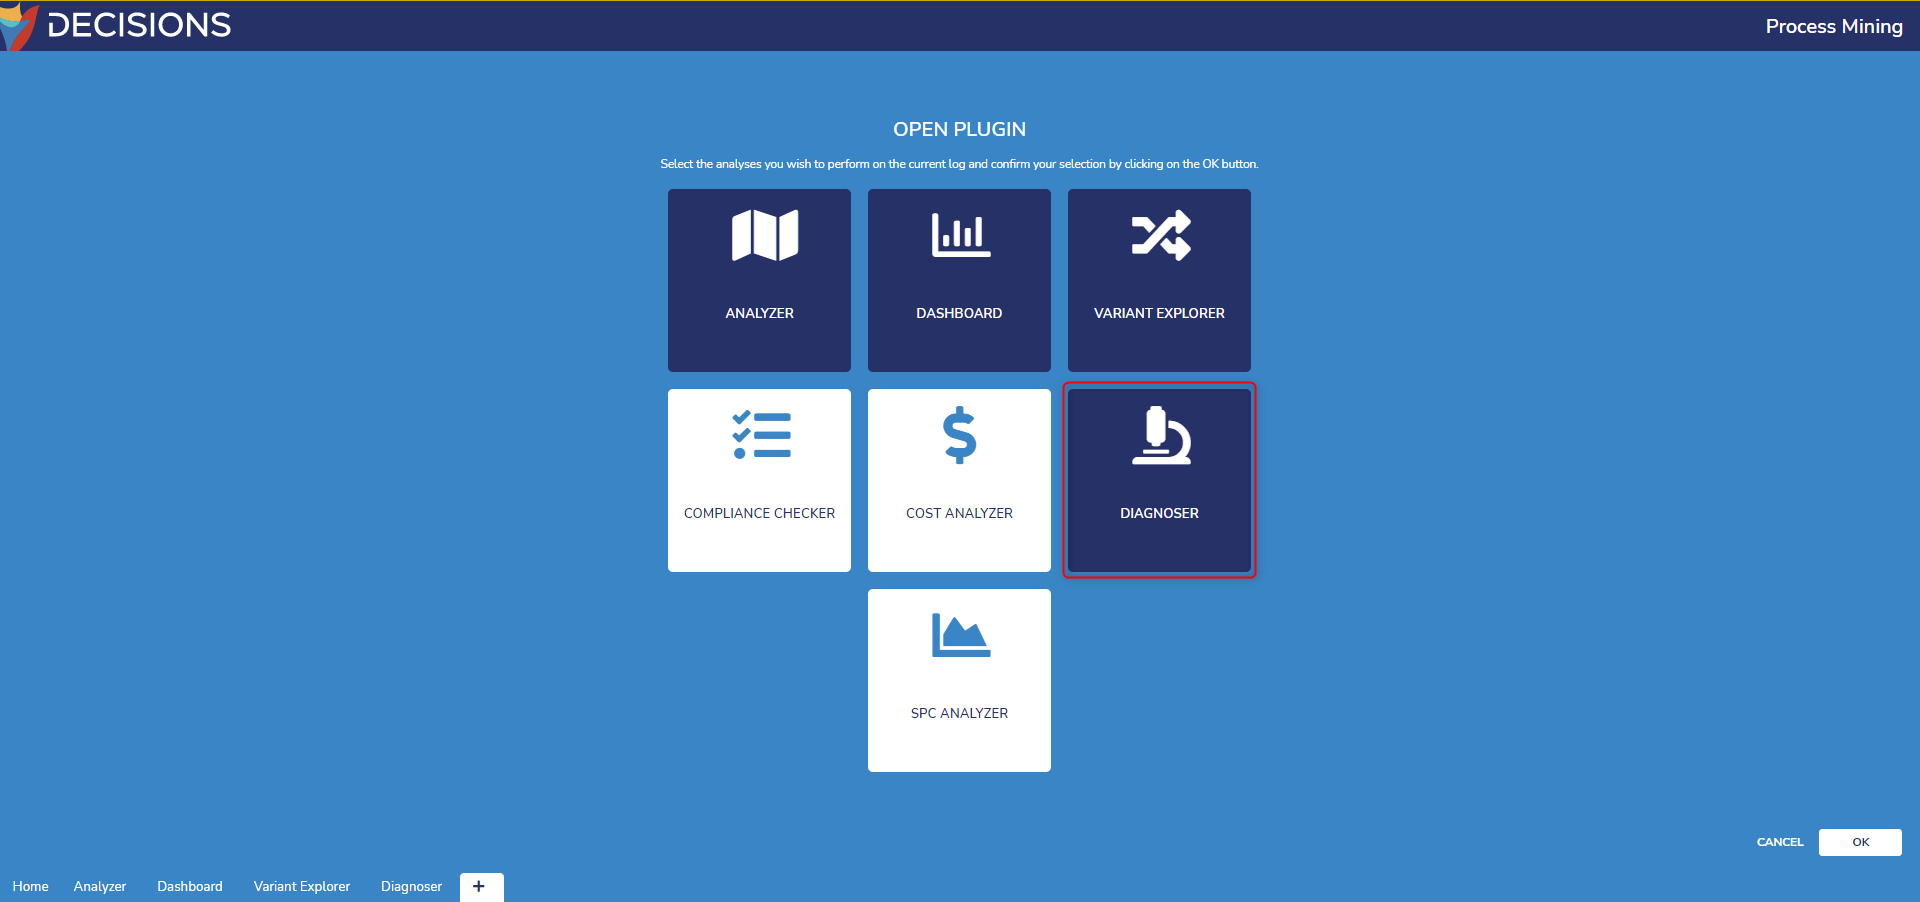
- Open an event log and select the plus icon at the bottom of the window. Select Diagnoser then OK to create a Diagnoser tab.
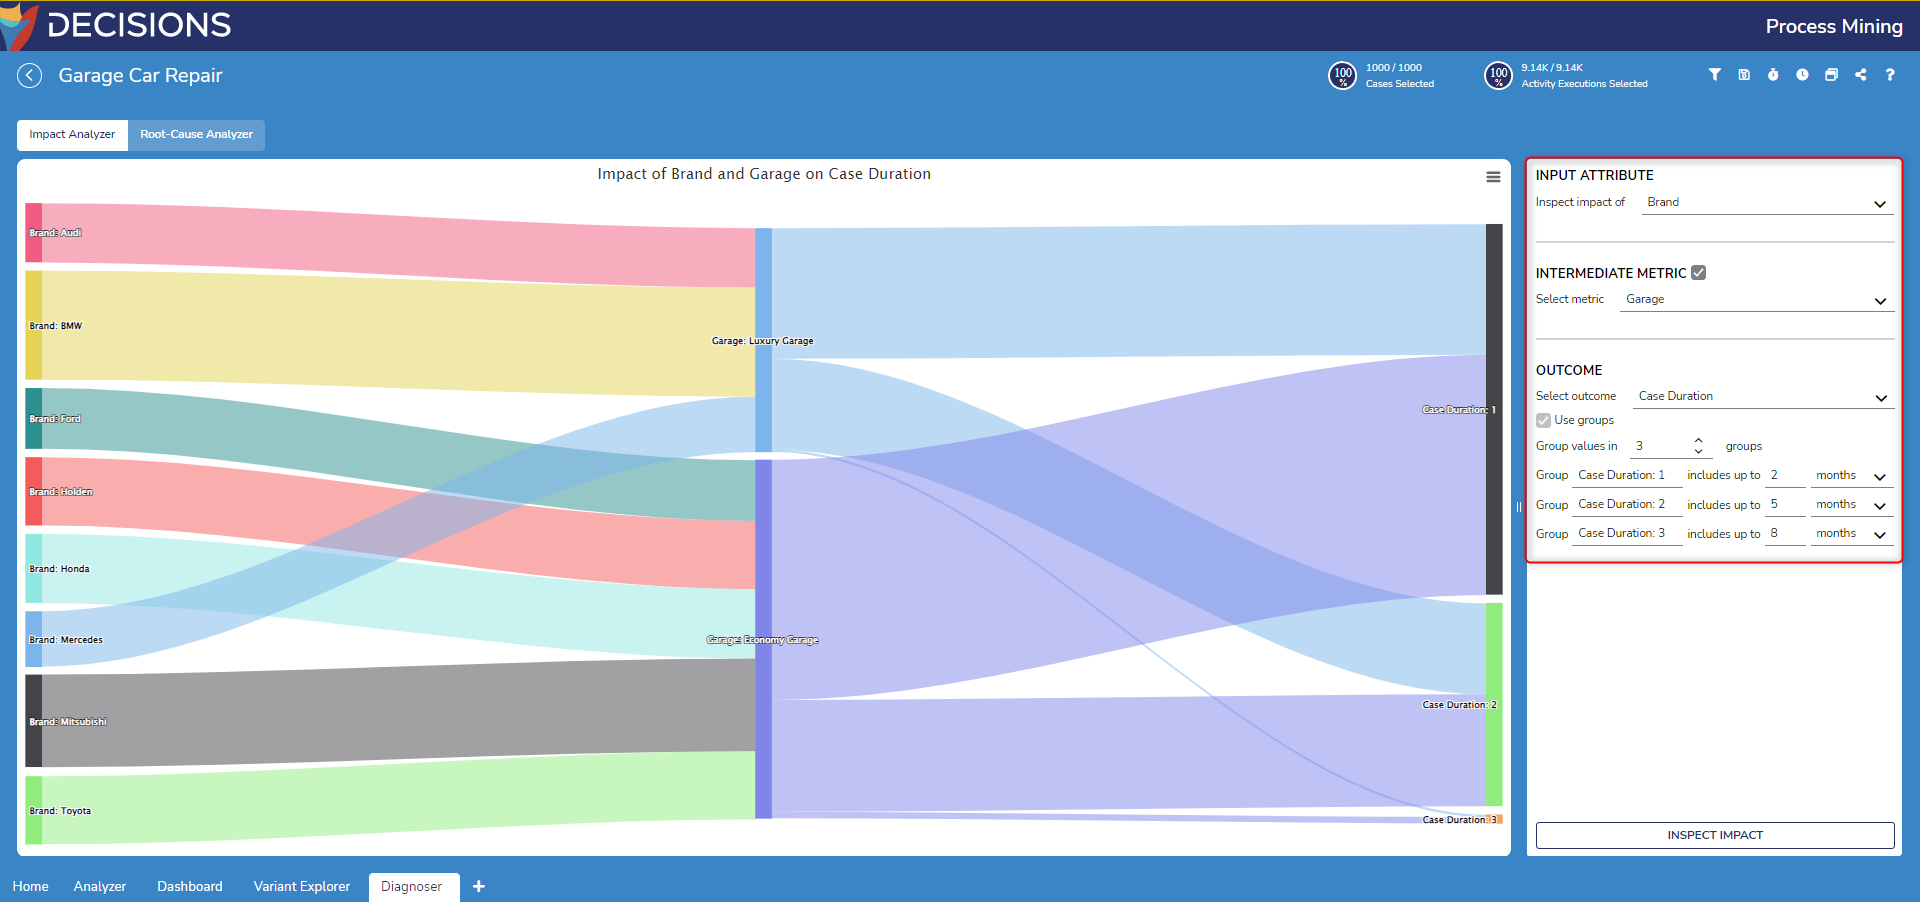
- Open the Diagnoser tab and the Impact Analyzer page opens by default. In the right column under Input Attribute, select an attribute for analysis. This example utilizes 'Brand' for car brands.
- For Intermediate Metric, set this to True. Expand the Select Metric dropdown setting to apply an attribute to filter. This example selects the 'Garage' attribute.
- Under Outcome, select the Case Duration option. Enable Use Groups and create three groups. The example groups separate attributes by durations between two months, five months, and eight months.
- Select Inspect Impact to generate the new diagram.
Hovering over a connection lists the path to either the intermediate metric or the outcome, its case count and its percentage.
Hovering over the attribute, intermediate metric, or outcome lists the count of its count of cases.
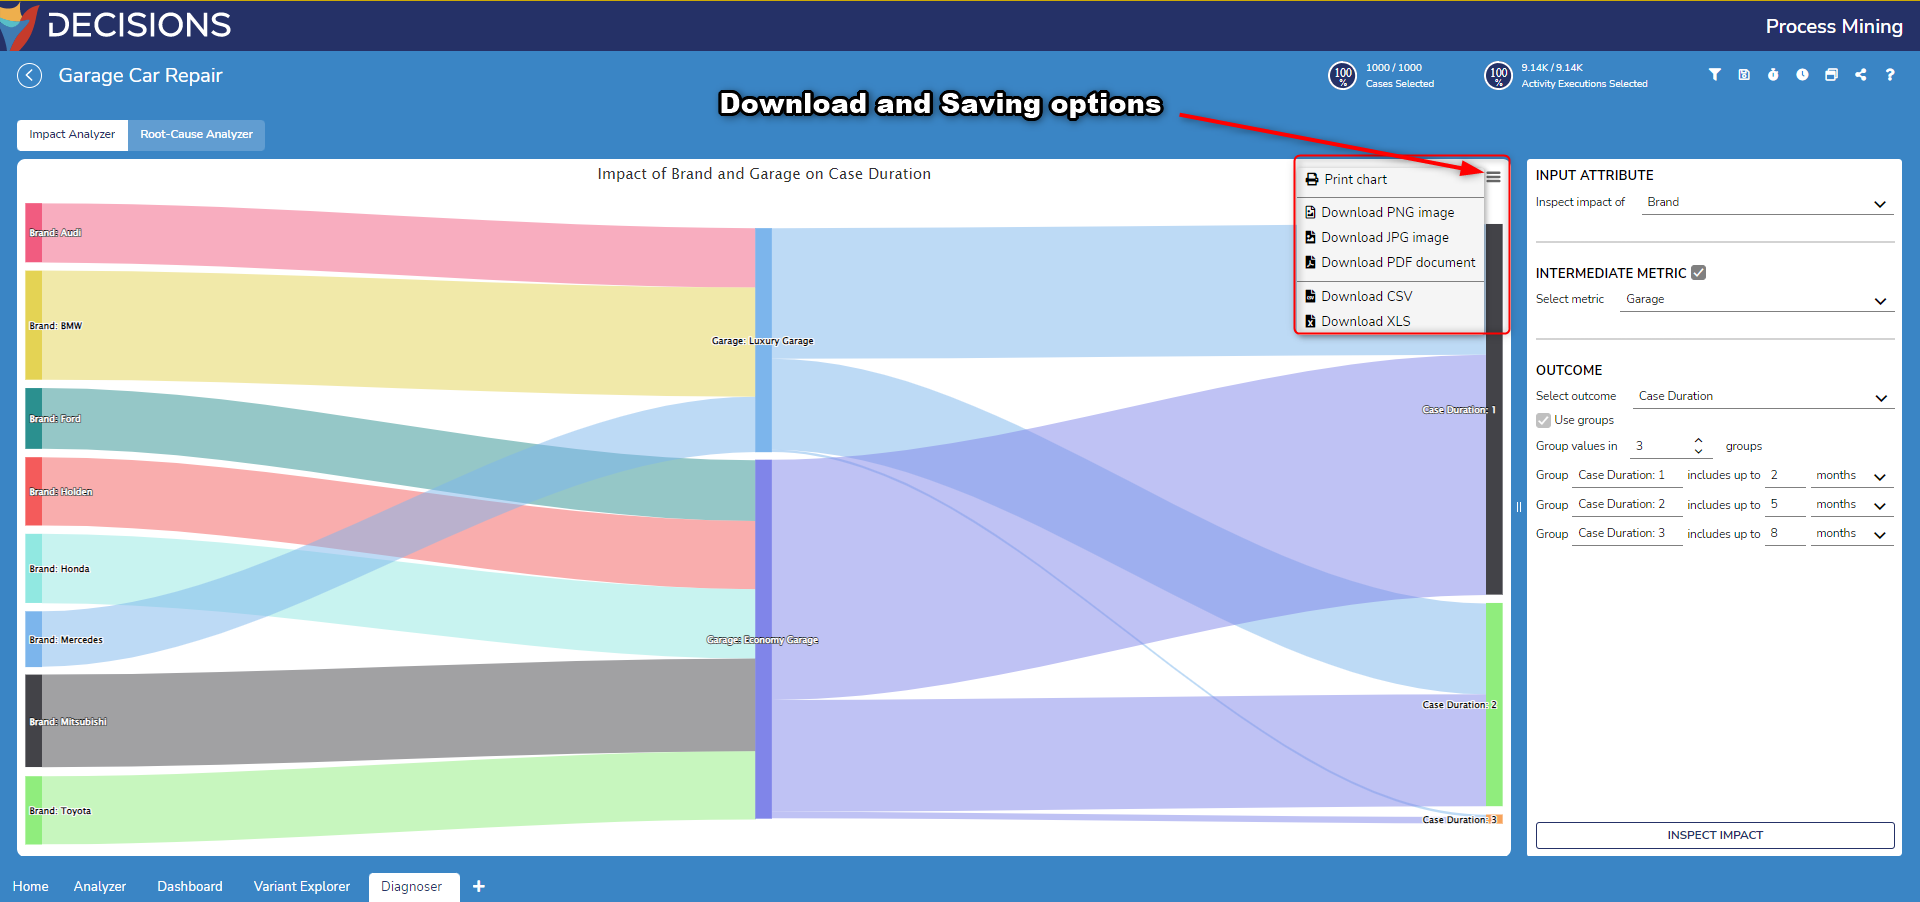
Saving the Diagram
Select the vertical gray bar icon at the top right of the Impact Analyzer's diagram. A window will pop up allowing users to either print or download the diagram into the following supported file extensions:
- PNG
- JPG
- CSV
- XLS