Adding a Tiles View to a Report
- 29 Sep 2022
- 1 Minute to read
- Print
- DarkLight
Adding a Tiles View to a Report
- Updated on 29 Sep 2022
- 1 Minute to read
- Print
- DarkLight
Article Summary
Share feedback
Thanks for sharing your feedback!
Overview
Reports in Decisions can be configured with several different Views, each changing how the data in the Report will appear. The Data view is always the standard for Reports, which lists the Report data and data fields as vertically stacked line items. The Tile view showcases the data as interactive tiles represented by an icon image.
Example
This example uses a Report sourced from data on all of the entities that live in the Decisions environment. The Tiles view is applied to this Report and previewed at runtime, showcasing the view and its capabilities.
- Select the CREATE REPORT button in a Designer Project from the top Action Bar.
- Select the Report tile on the left, provide a name, and then select CREATE.
- In the Report Designer, select the Add button under Data Sources.
- Expand the Common folder and select Entity Data Source.
- Select the Add button under Data Fields and select Entity Name, Entity Type Short Name, and Create On Date.
- Select the Add button under Views and choose Tiles from the list. This will overtake the Report data and change it to the Tiles view.
- Save and close the Report Designer once complete.
- In the Designer Project, right-click the name of the Report and select the Run Report button from the Action Menu.
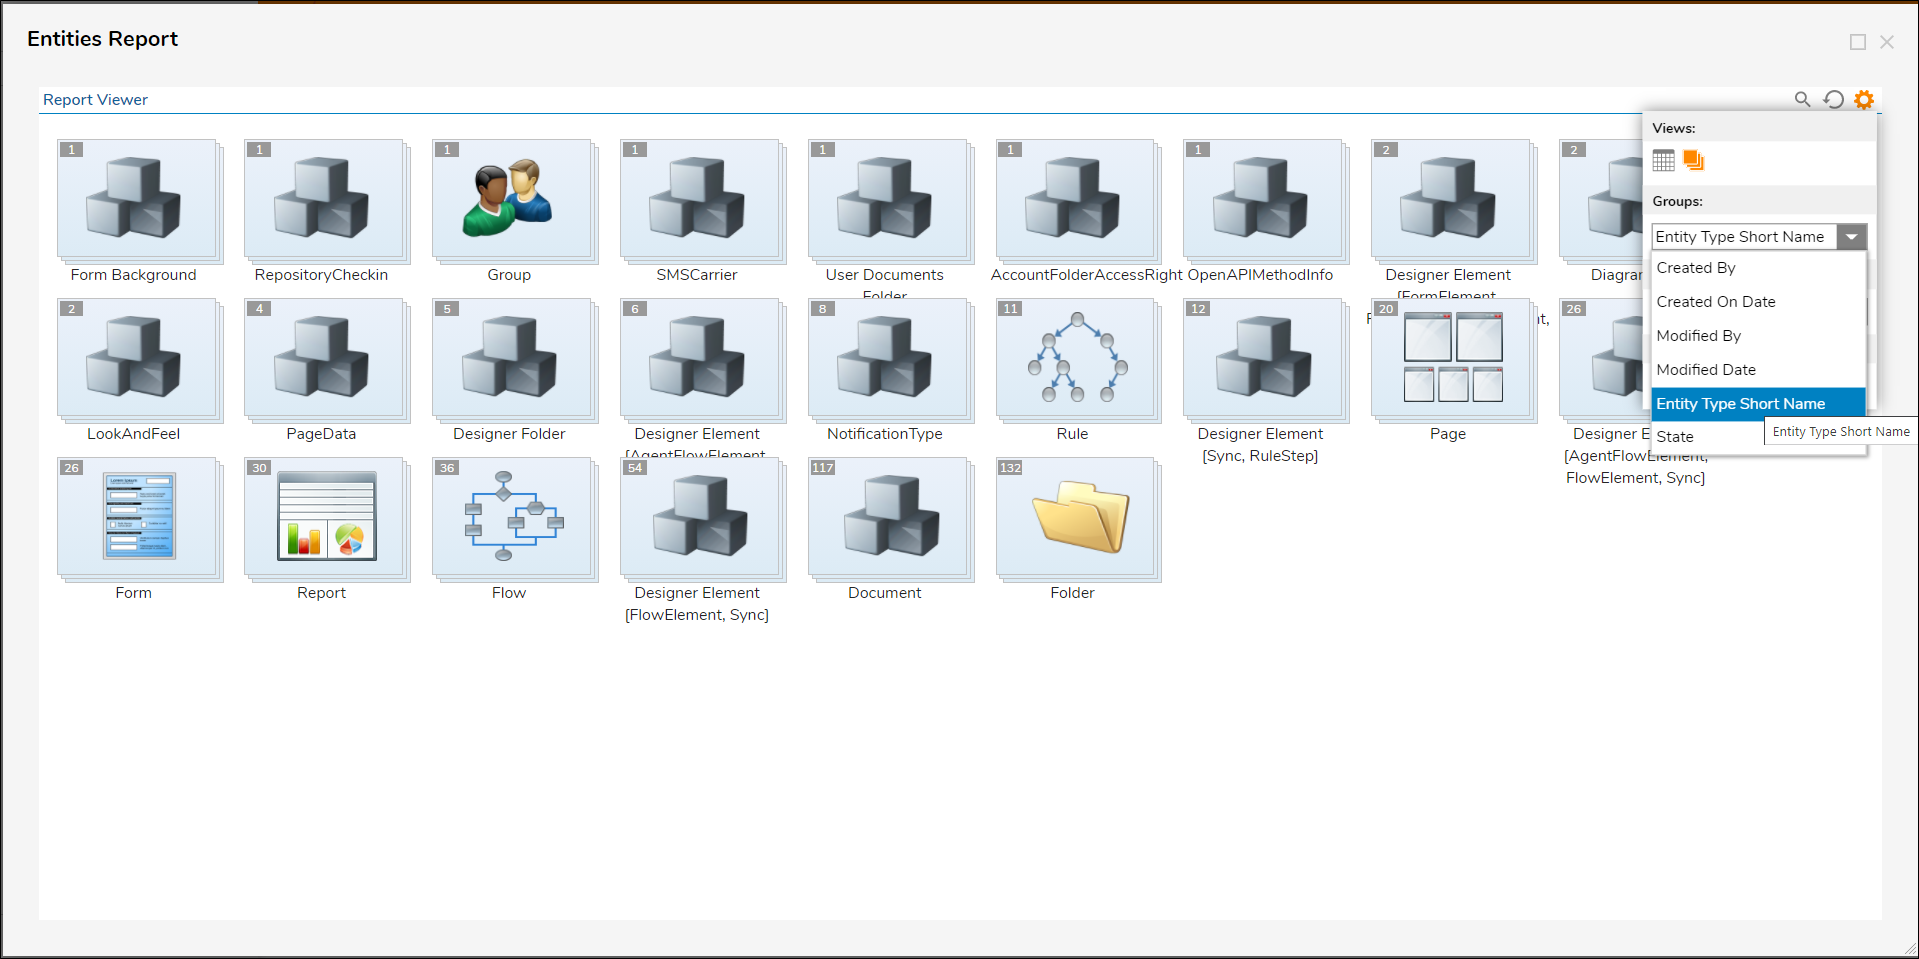
- When the Report appears, select the gear icon in the top right and choose the Tiles icon.
- Notice that there is a tile icon for each user in the environment, where each tile (if selected) contains the data view of all the entities under the selected user account.
- Select the gear icon to view tools available for grouping the tiles by a specific Data Field and/or sort the icons in an affixed ascending or descending order.
- Group the Report data by the Entity Type Short Name field to see how broad the Tiles view can scale.


Was this article helpful?