The FAFSA Job Scheduling & Monitoring Dashboards provide real-time and historical insights into the performance, reliability, and efficiency of ISIR file processing workflows. These visualizations allow both IT teams and financial aid staff to monitor the operational health of automated job executions, troubleshoot failures, and optimize scheduling performance, all without needing direct access to Banner.
Performance Overview
The first set of charts presents a high-level view of job activity and success rates, helping financial aid and IT teams monitor processing health at a glance.
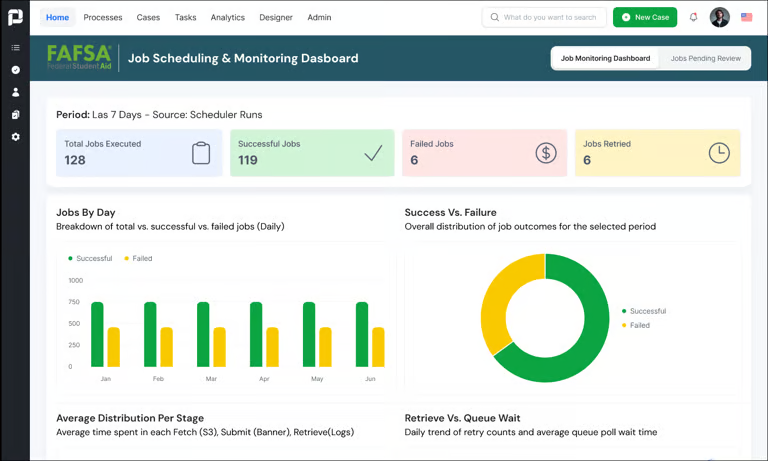
Job Metrics Summary
At the top of the dashboard, four key metrics summarize FAFSA job activity over the selected time period:
Total Jobs Executed
Successful Jobs
Failed Jobs
Jobs Retried
This view supports quick operational assessments without needing to log into Banner.
Jobs by Day
This chart displays the number of jobs processed each day (Mon–Sun), categorized by outcome:
✅ Successful (teal bars)
❌ Failed (yellow bars)
Use this visualization to spot patterns such as high failure days or processing volume trends.
Success vs. Failure Distribution
The donut chart to the right visualizes the overall job outcome ratio during the reporting window:
Majority successful (teal)
Minority failed (yellow)
This quick snapshot supports SLA monitoring and system health reviews.
Detailed Execution Metrics & Job Logs
This section provides deeper insights into job duration, retry trends, and individual job details, enabling diagnostics and performance tuning.
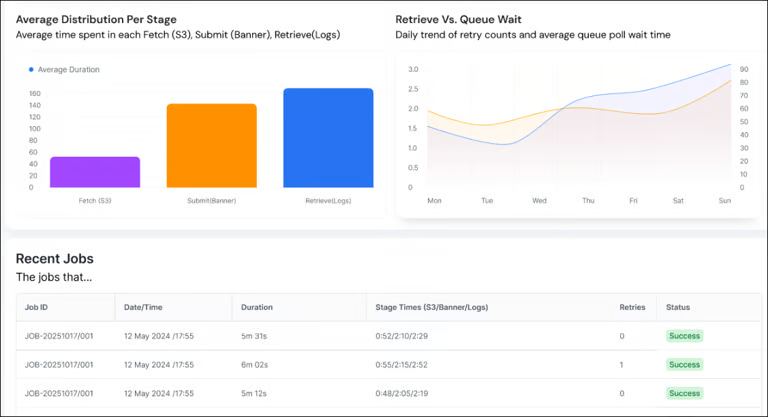
Average Duration per Stage
A bar graph shows the average processing time (in seconds) for each phase of the workflow:
Fetch (S3)
Submit (Banner)
Retrieve (Logs)
This helps identify stages that may be experiencing latency or require optimization.
Pay close attention to spikes in max latency and an increasing error rate, especially during peak usage periods.
Retries & Queue Wait Time
A line chart visualizes:
Retry Count per day (yellow line)
Average Wait Time before job processing begins (blue line)
These metrics reveal:
Whether system issues are causing frequent retries
How long jobs remain in queue before execution
Recent Jobs Table
This detailed table lists the most recent FAFSA job executions, including:
Field | Description |
|---|---|
Job ID | Unique execution identifier |
Date/Time | Start time of the job |
Duration | Total time taken for execution |
Stage Times | Time breakdown per stage |
Retries | Number of retry attempts |
Status | Final outcome (Success or Failed) |
Use this section to:
Investigate failed jobs
Compare performance across executions
Review retry behavior