Overview
The Event Viewer folder contains various Reports used by Administrators to troubleshoot Decisions. These Reports will only contain information if the feature is used.
Event Viewer Report
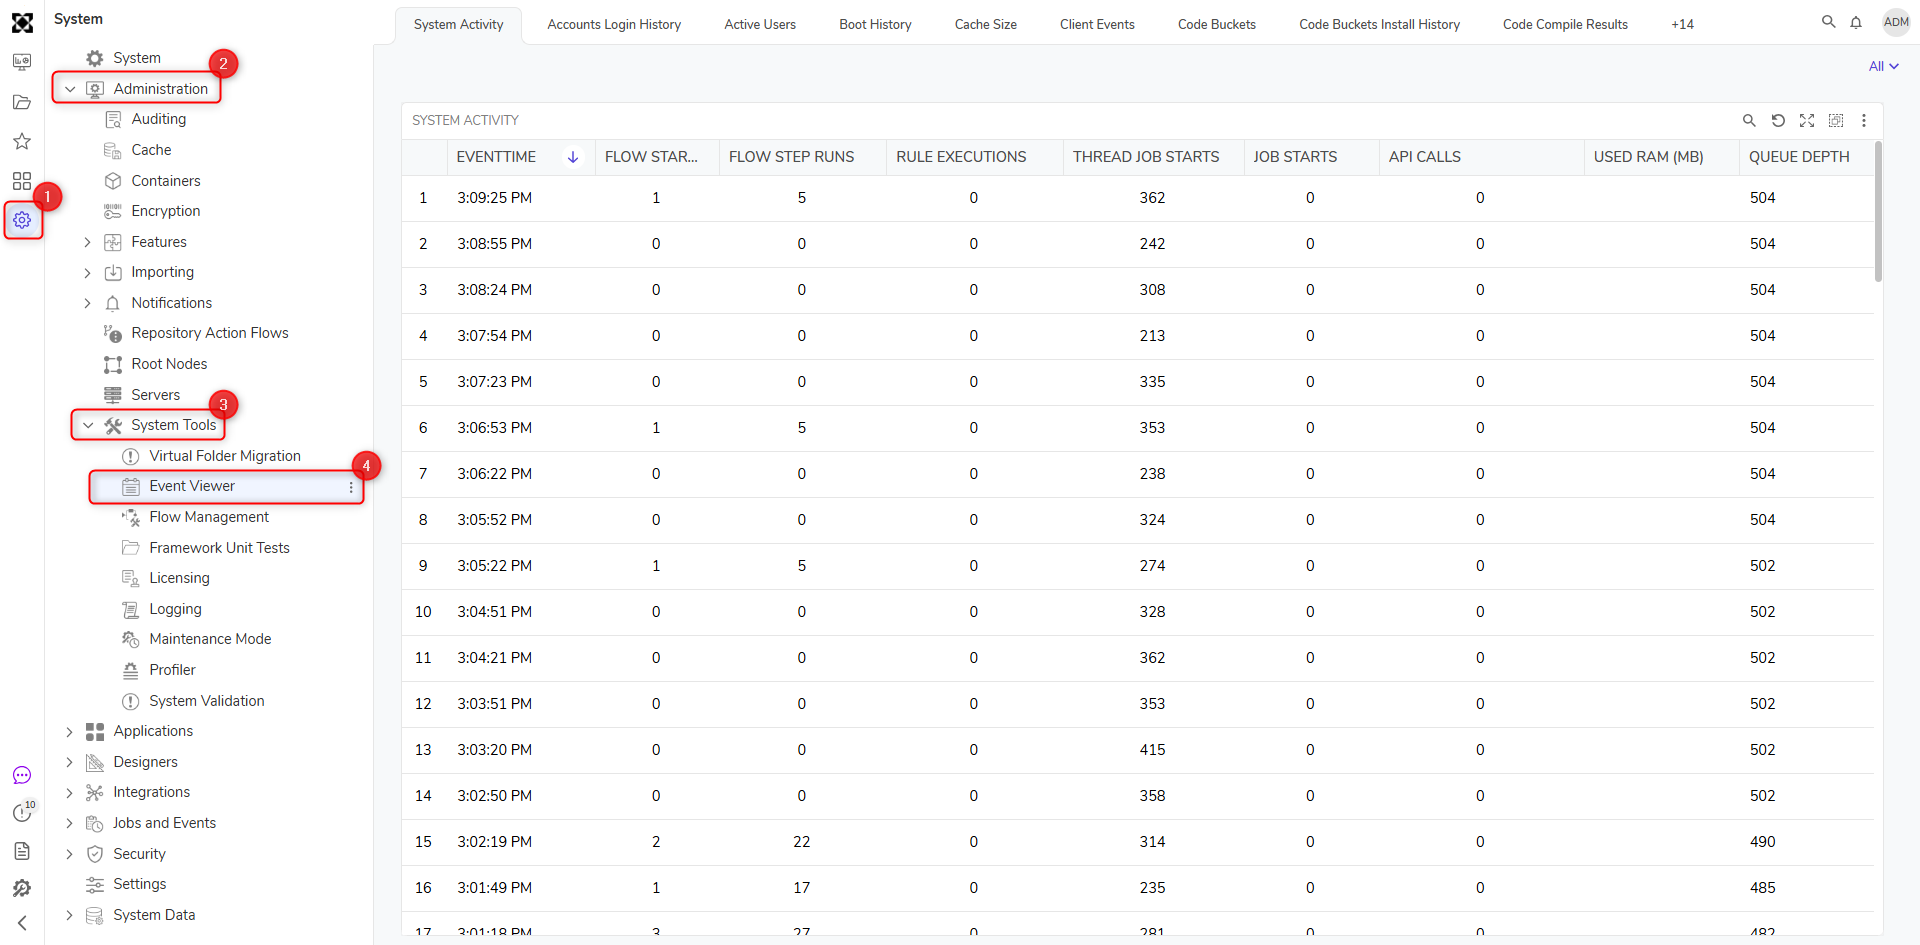
The EVENT VIEWER can be located by navigating to System > Administration > System Tools > Event View. The Event View Report displays time stamps, warning levels, the category of messages, and the description of messages.
Show Details
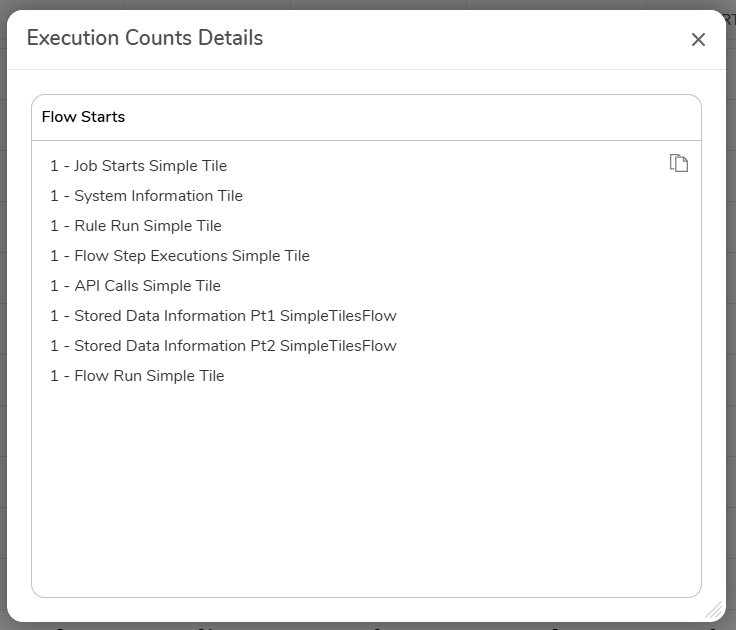
Users can right click any event in this report and see additional details in a copyable format. This is only available in v9.9.
Accounts Login History
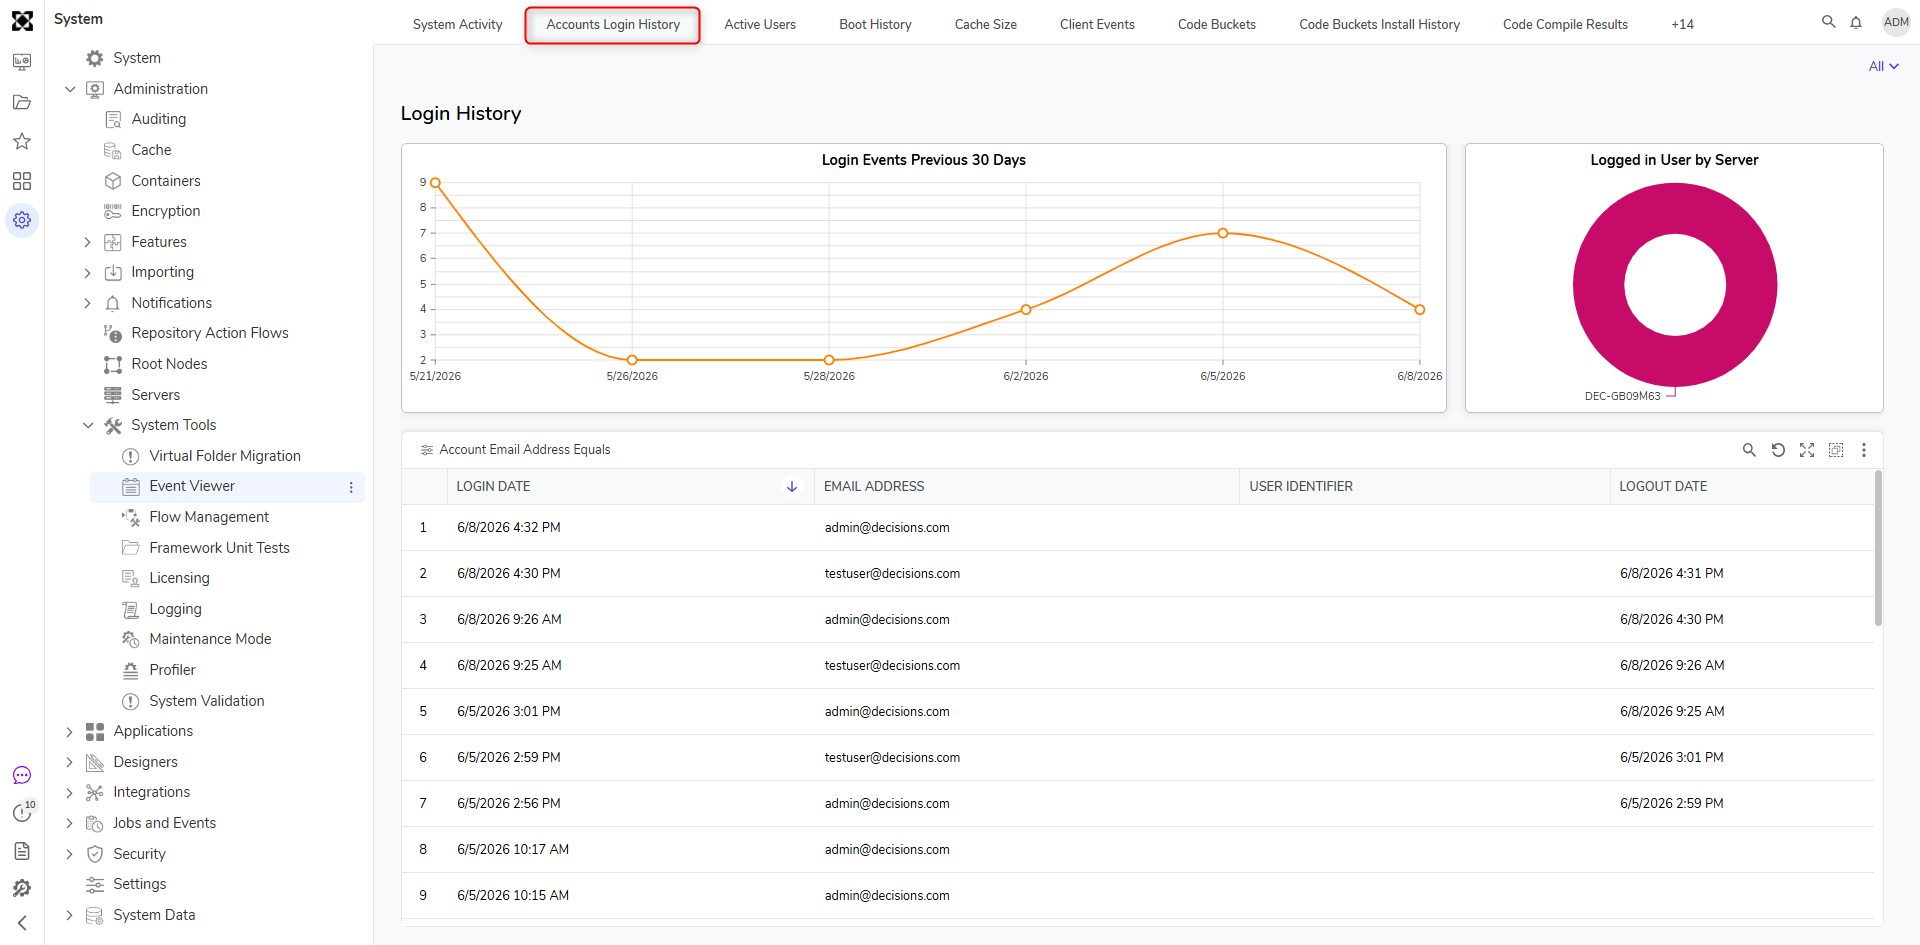
The ACCOUNT LOGIN HISTORY tracks the LOGIN DATE, EMAIL ADDRESS of the user, and the LOGOUT DATE all users in the instance.
Active Users
The ACTIVE USERS displays the ACCOUNT ID, MACHINE NAME, SERVER, OS, LAST UPDATE LOCATION, and EMAIL ADDRESS associated with the currently active user(s).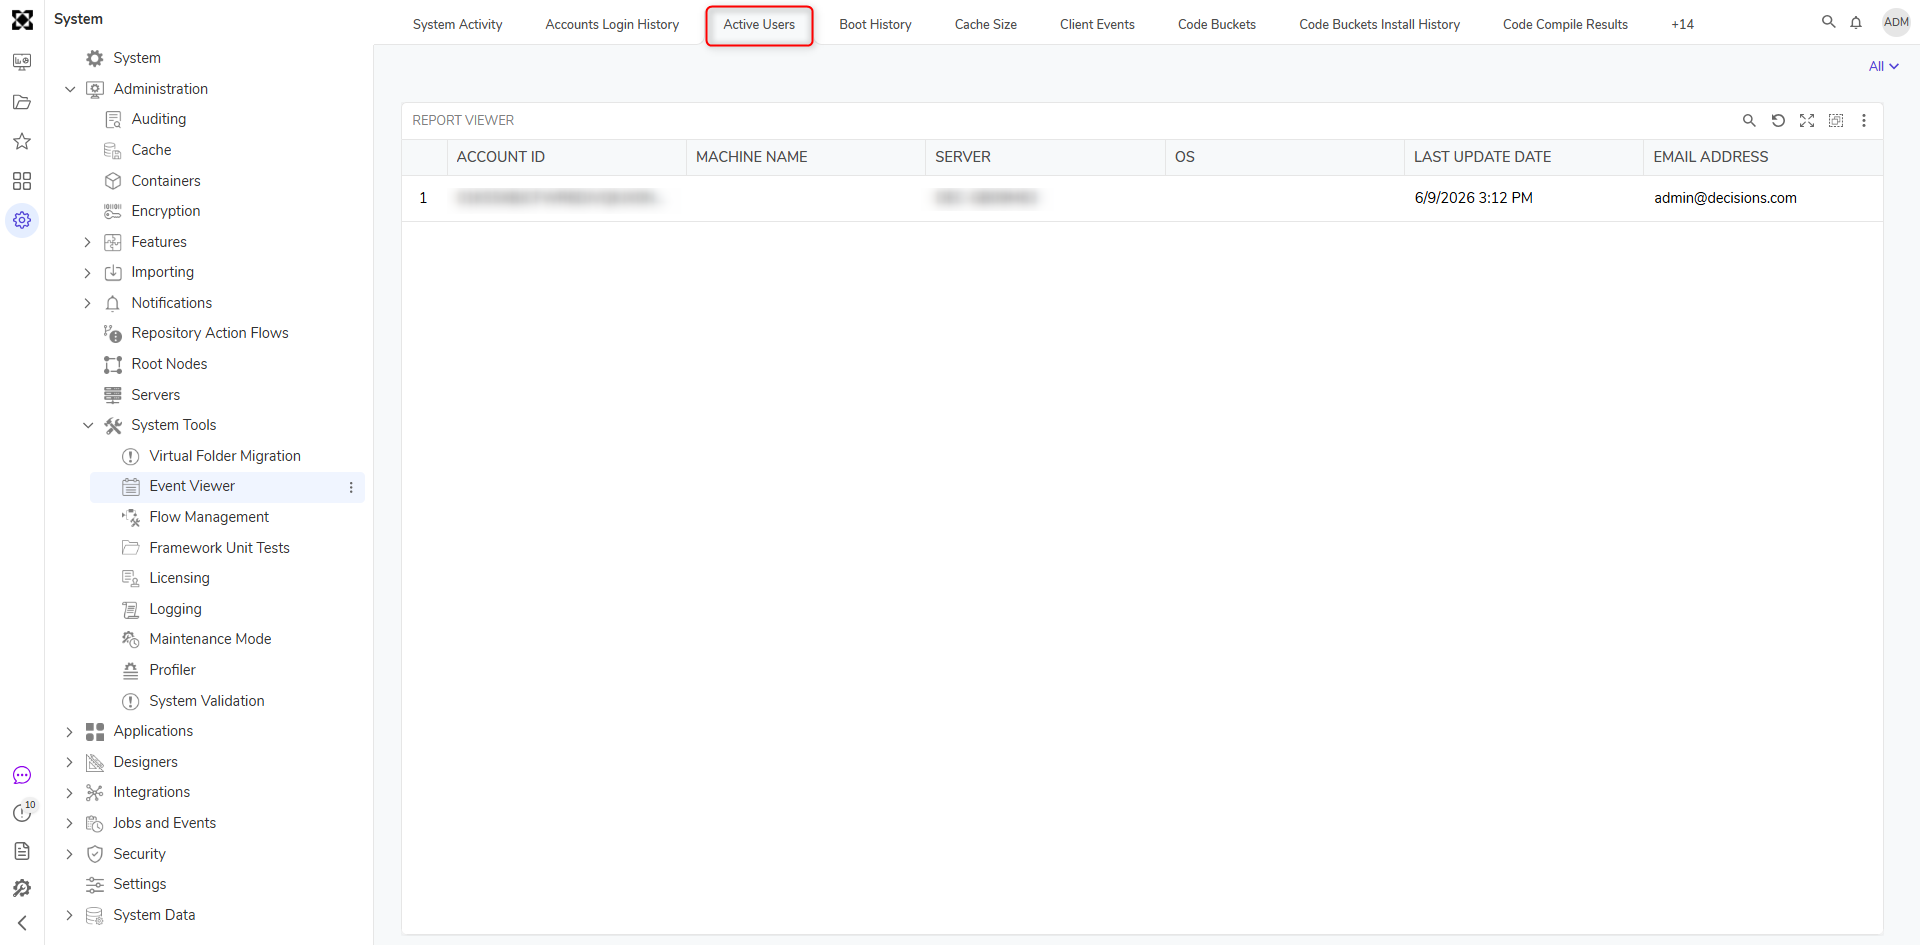
Soft Deleted Entities
When an Entity is marked as Deleted, it is also marked as Archived and an Archive Date is automatically generated for 30 days in the future. The Soft Deleted Entities Report shows Deleted Entities (ENTITY NAME), deletion date (DELETED ON), and who they were DELETED BY. The available actions on each Deleted Entity are Set Archive Date, Unarchive Designer Element [PageElement], and Undelete Designer Element [PageElement].
Alternatively, entities may be undeleted.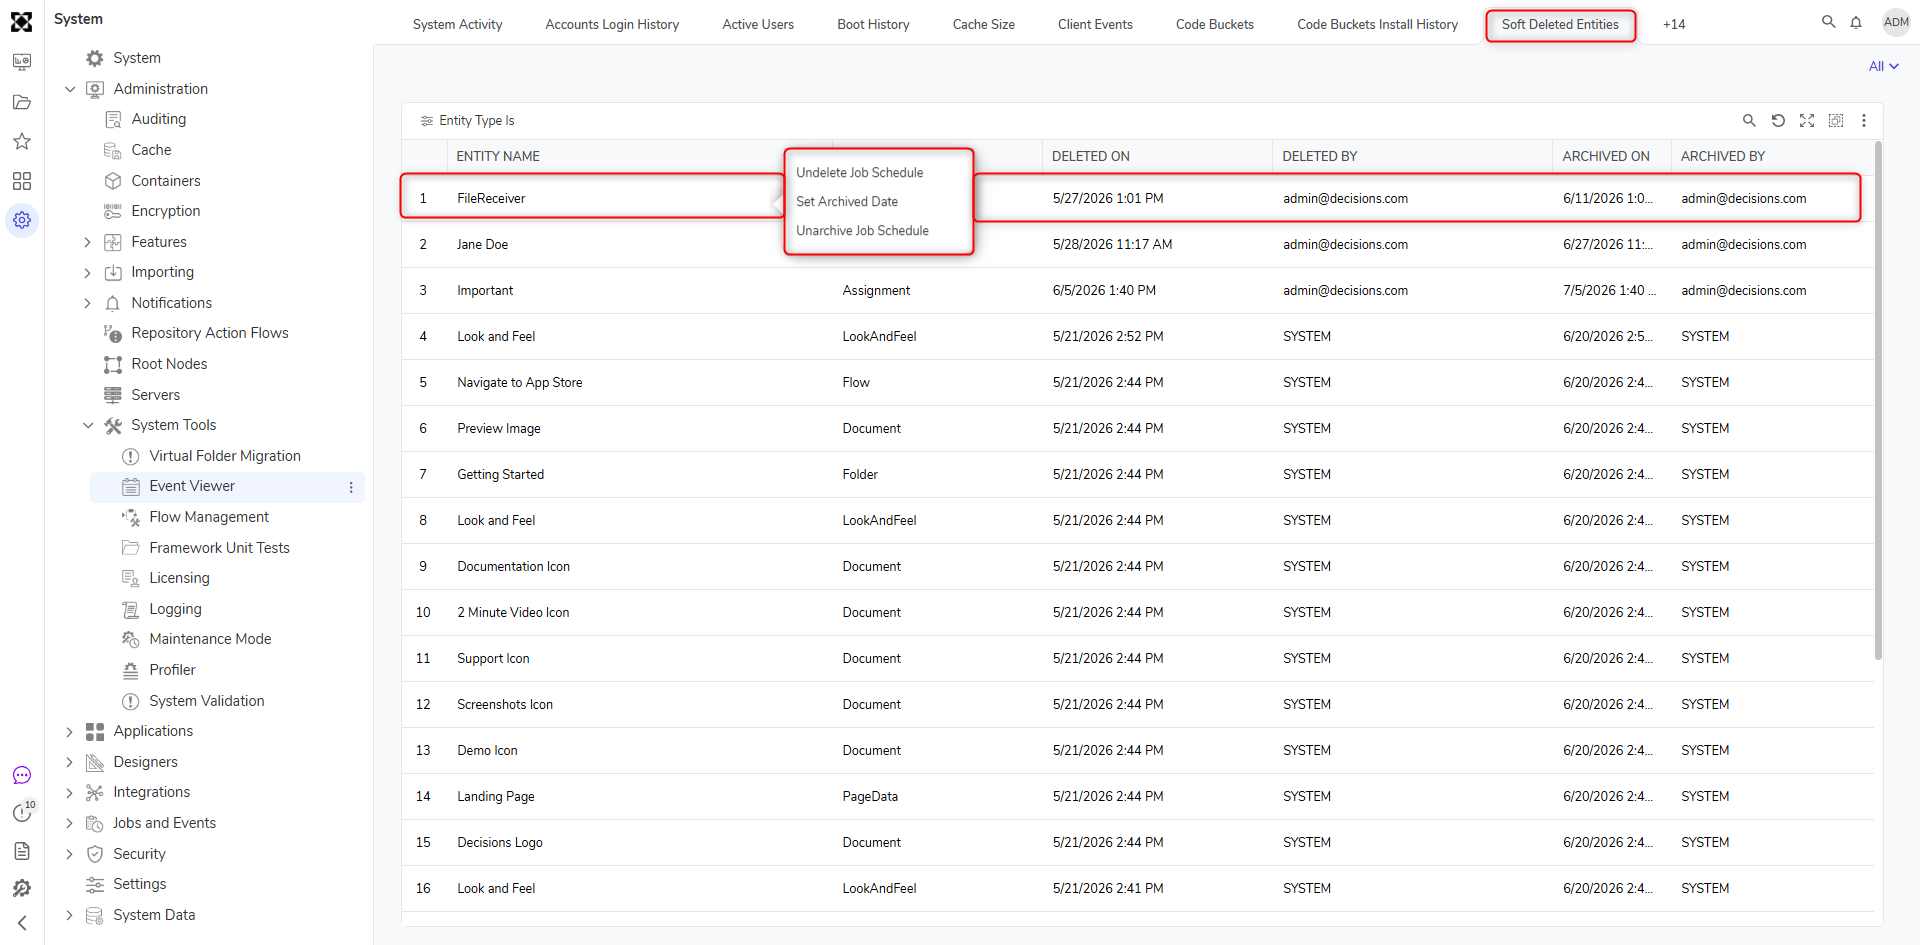
Boot History
The BOOT HISTORY Report displays the date and time of when an Instance was restarted under WHEN BOOTED. It also lists the VERSION, IP ADDRESS, MACHINE NAME, RESTARTED BY, and the RESTARTED REASON.
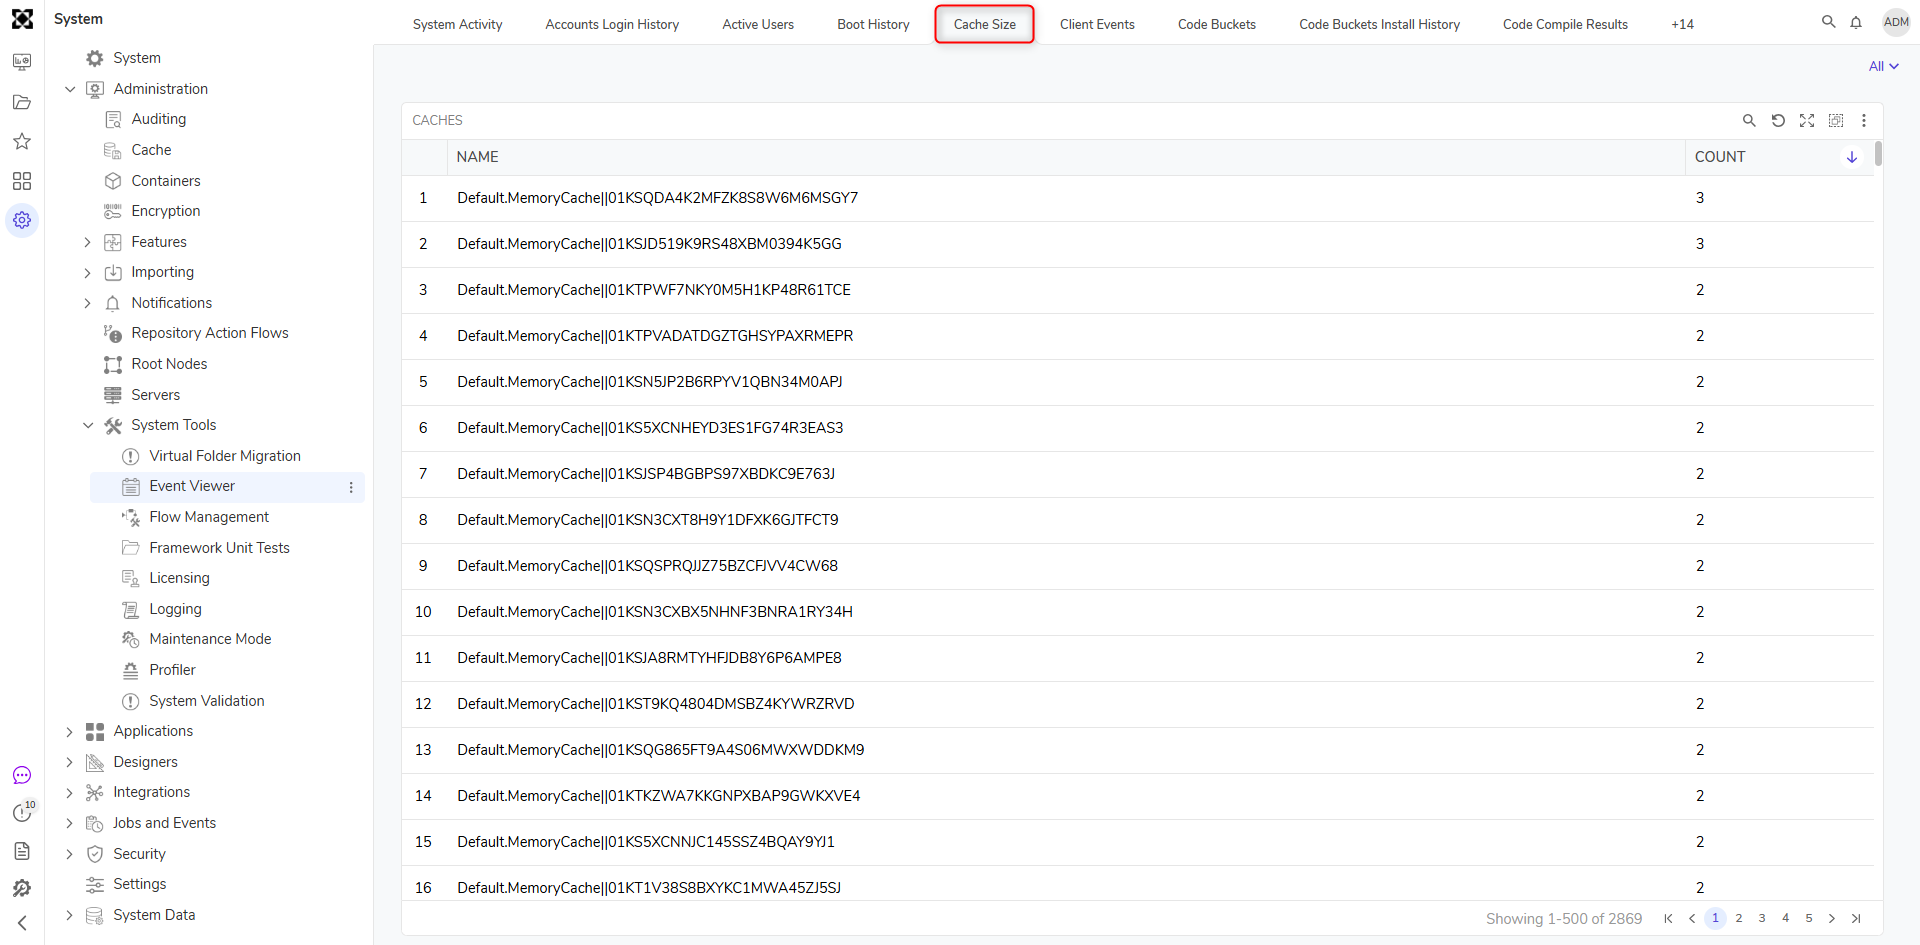
Cache Size
The CACHE SIZE Report displays the different Cache Definitions and the size (COUNT) they consume. Size means the number of unique keys within the cache - so the number of items. Note that a list counts as a single key for this instance. This does not reflect how much memory the cache is using. This Report also appears within Projects in the Cache configuration section.
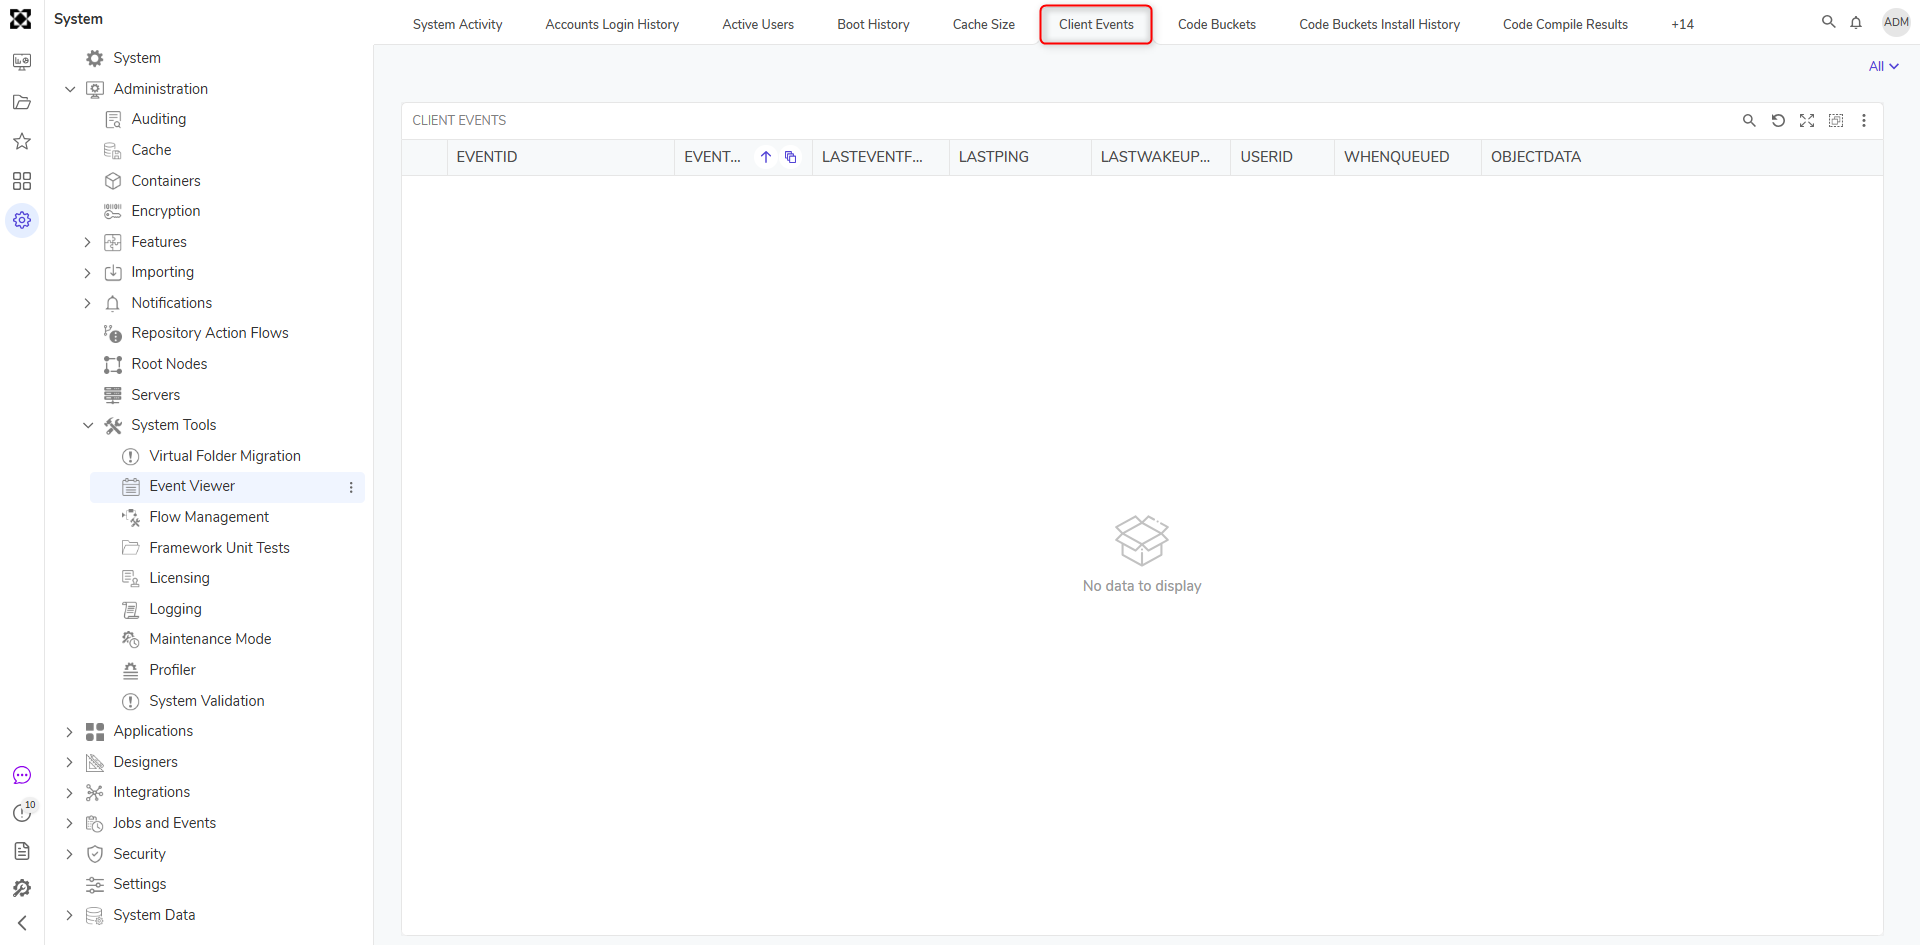
Client Events
The CLIENT EVENTS Report shows a list of activities occurring on each User Session. This tracks all of the Events being sent to the browser session while a user is logged in.
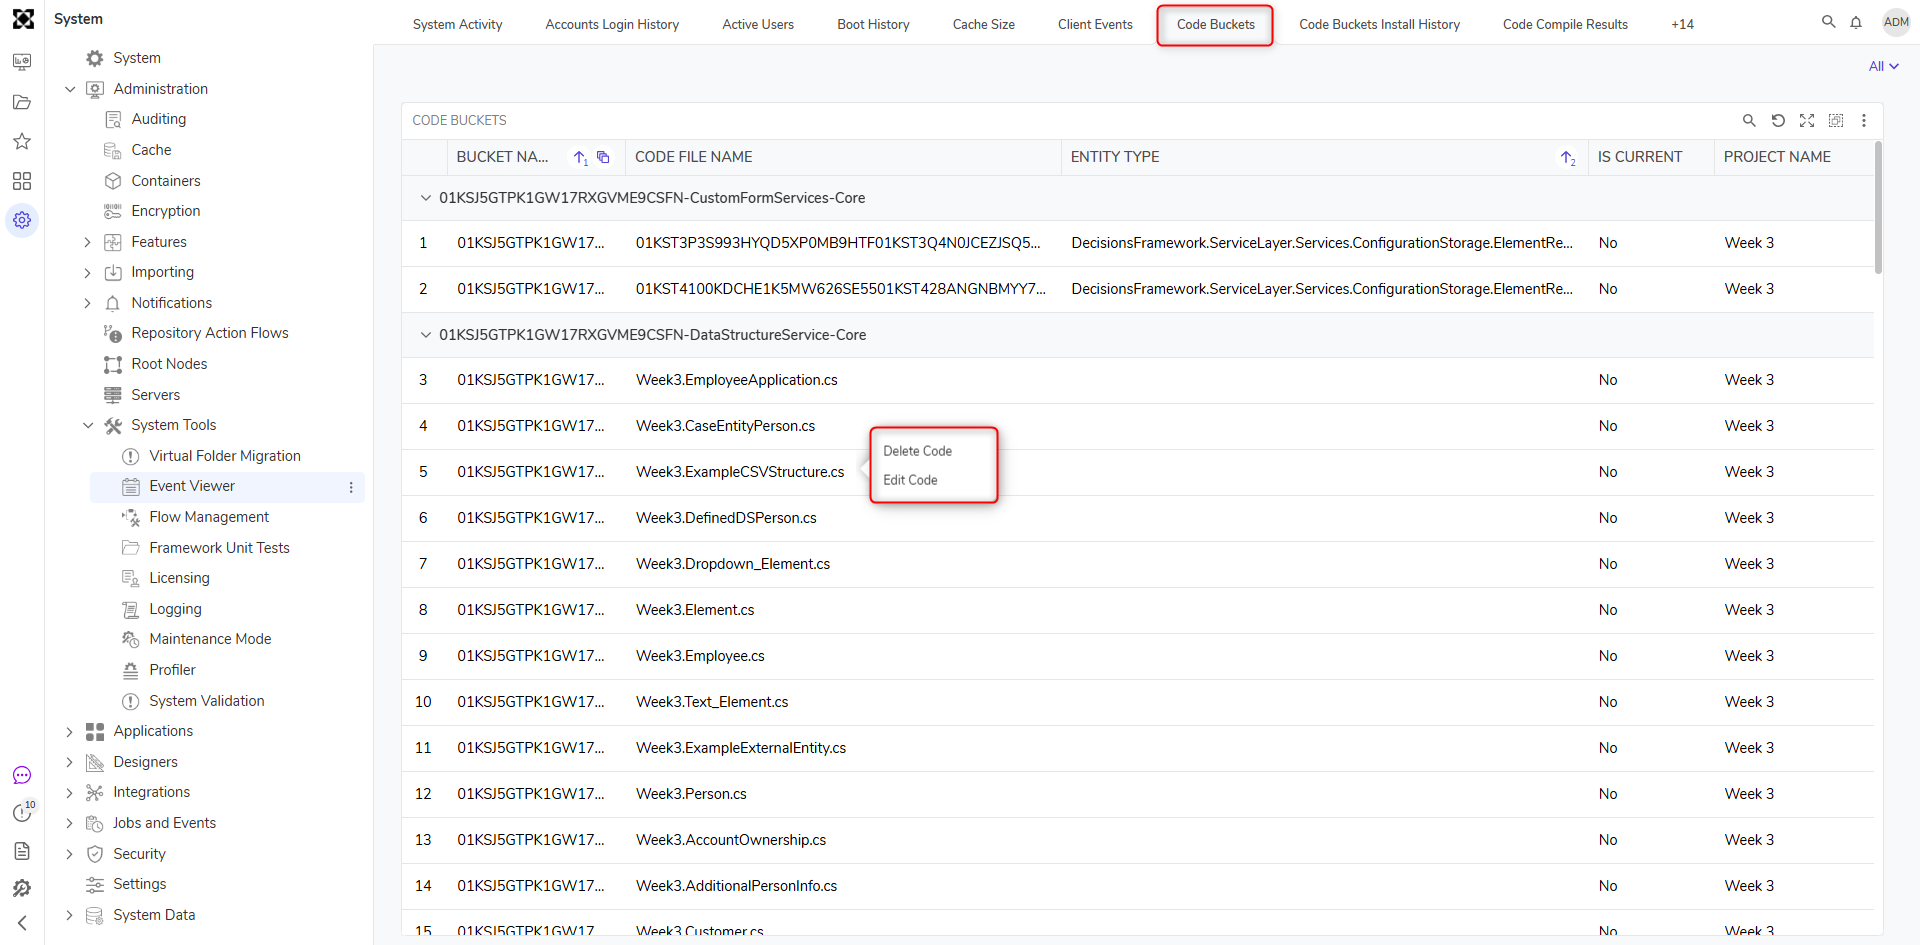
Code Buckets
When Decisions compiles any custom structure or service, it will generate a .cs file dynamically and place this file in CODE BUCKETS.
The Report displays all Code Bucket files (BUCKET NAME and CODE FILE NAME) that have been compiled inside Decisions. There are actions to Edit Code or Delete Code.
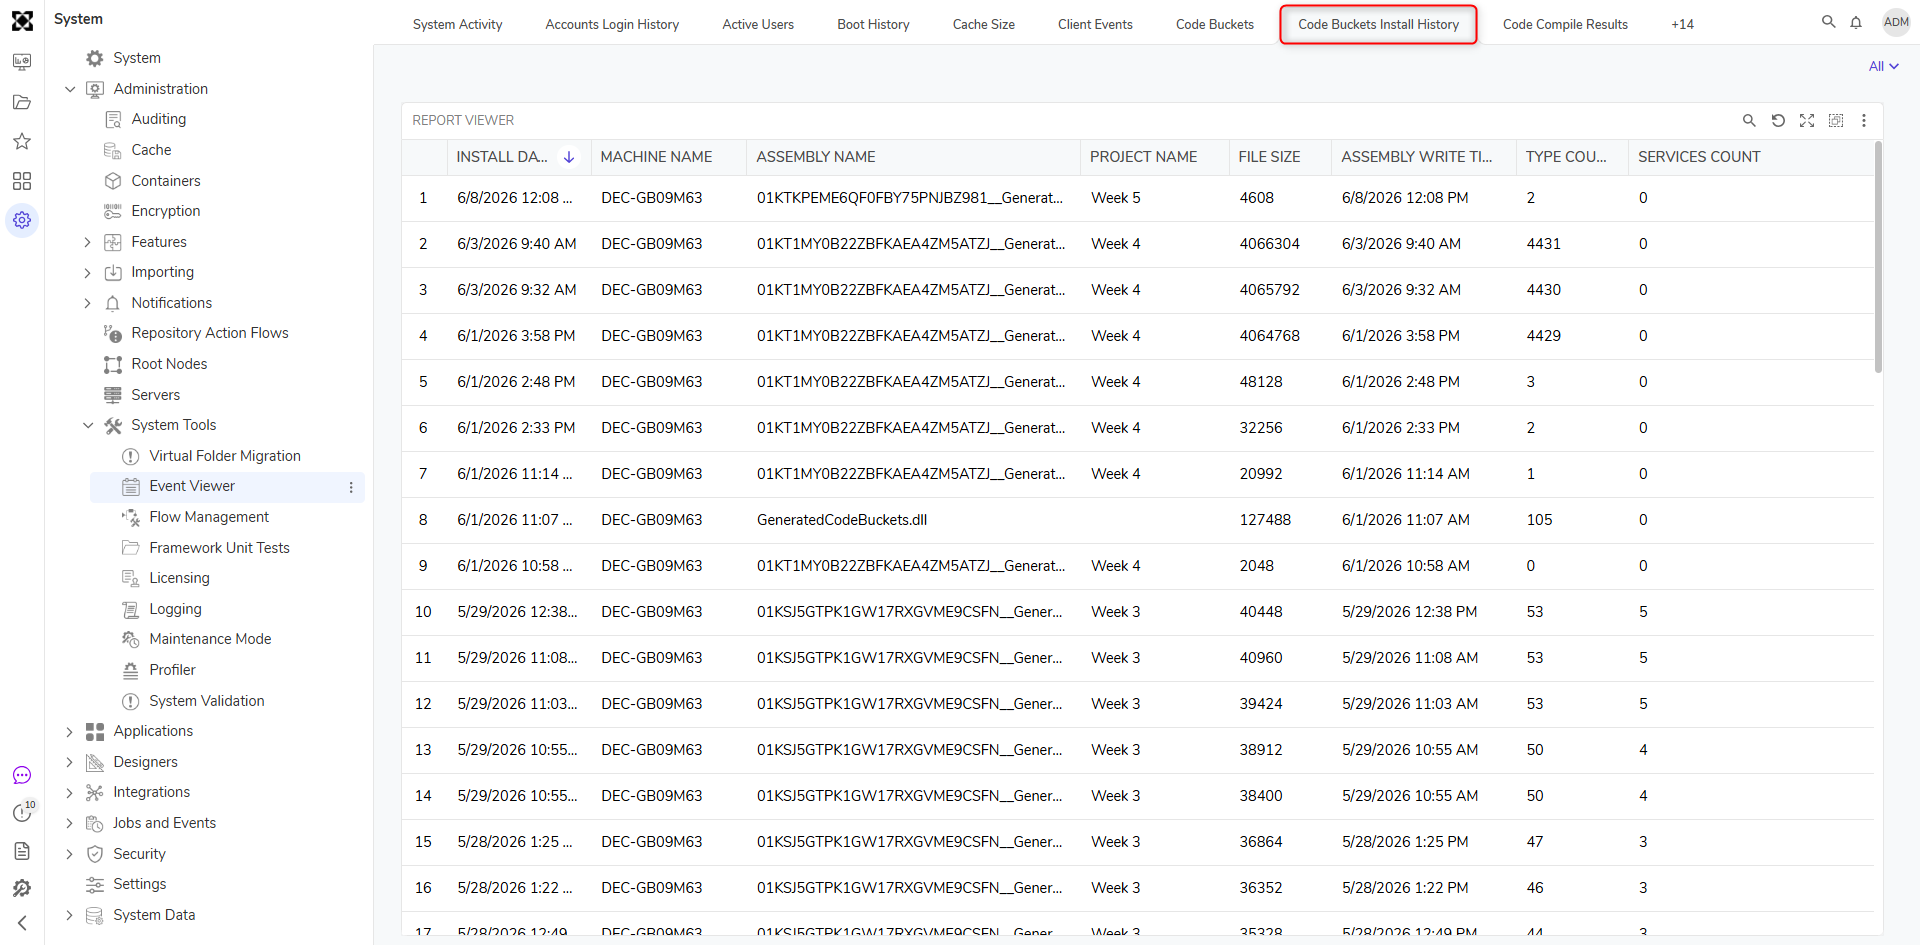
Code Bucket Install History
As new Code Buckets get generated by user actions or by generated services, the compiled code gets installed into Decisions. The CODE BUCKETS INSTALL HISTORY Report will show when a new code has been compiled and installed.
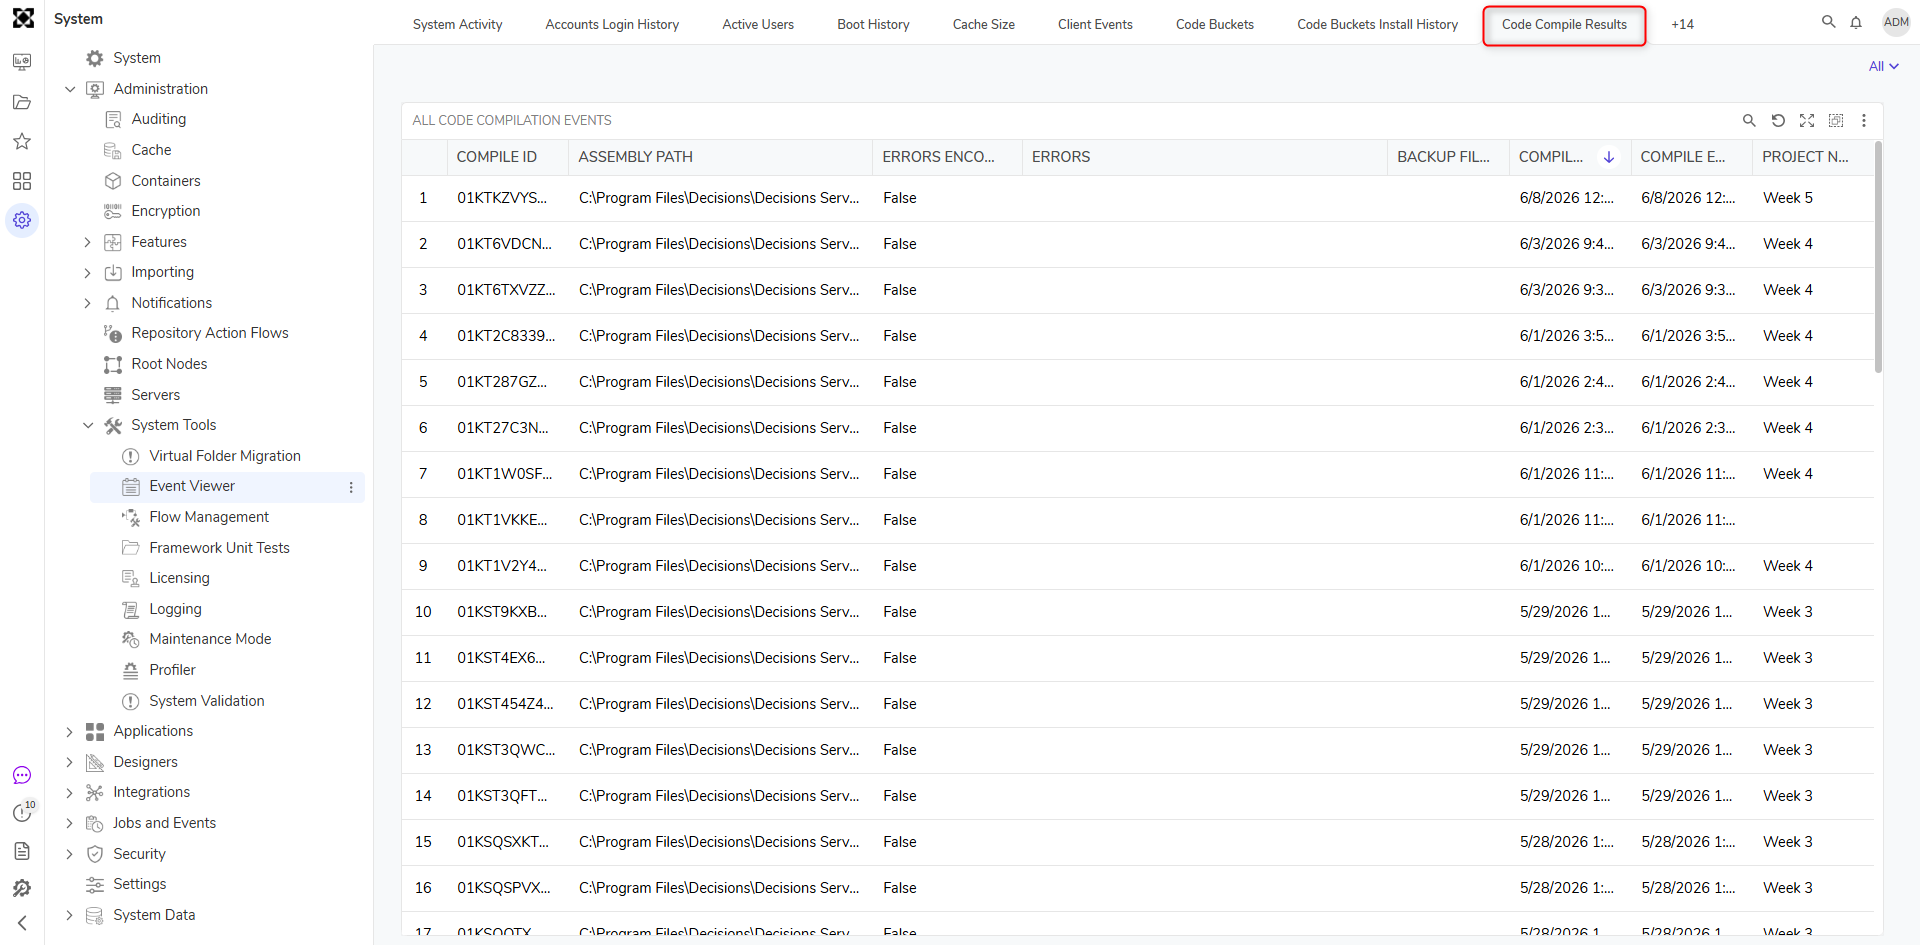
Code Compile Results
All generated structures and integrations will compile code within Decisions. Any Integration that creates Flow steps or Data Types will trigger a code compile. This report shows a list of the Files that have been compiled (COMPILE ID) and whether or not any of them ran into any issues (ERRORS ENCOUNTERED/ERRORS).
Data Structure Status
The DATA STRUCTURE STATUS Report shows every Data Structure within Decisions including whether or not they are compiled (STATE). Actions on this Report include modifying and viewing the data structure and re-compiling if it is unloaded (RETRY).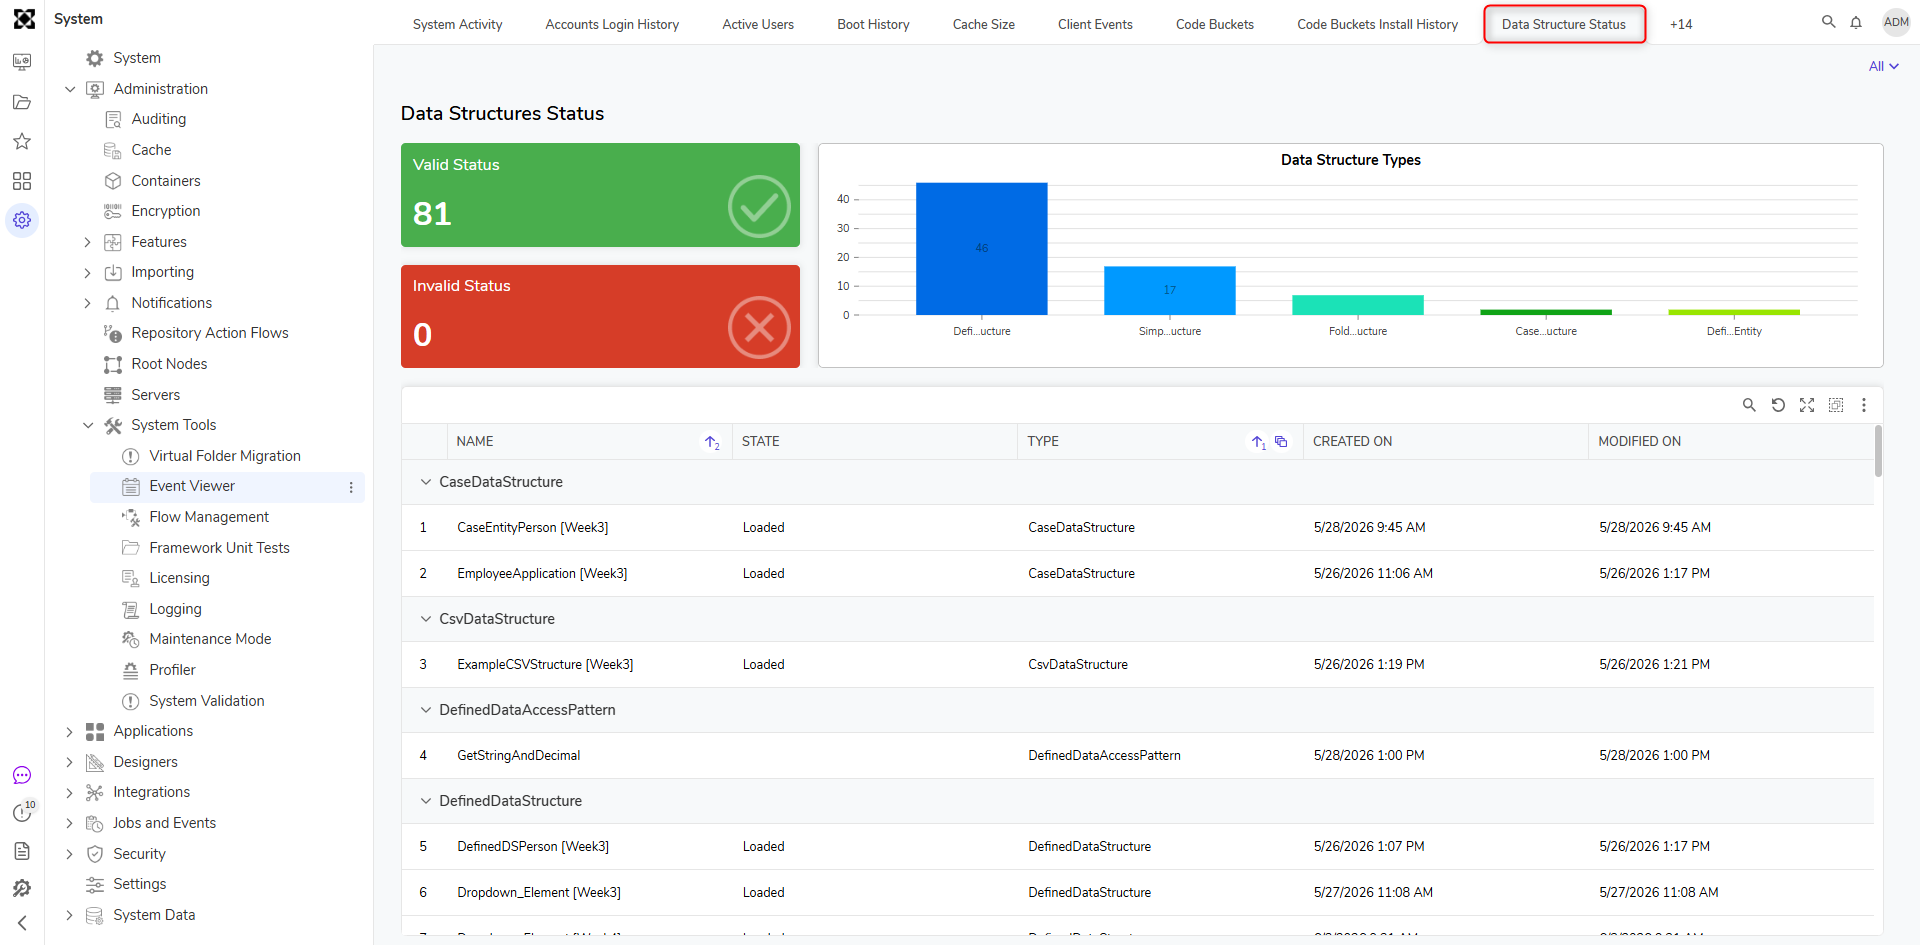
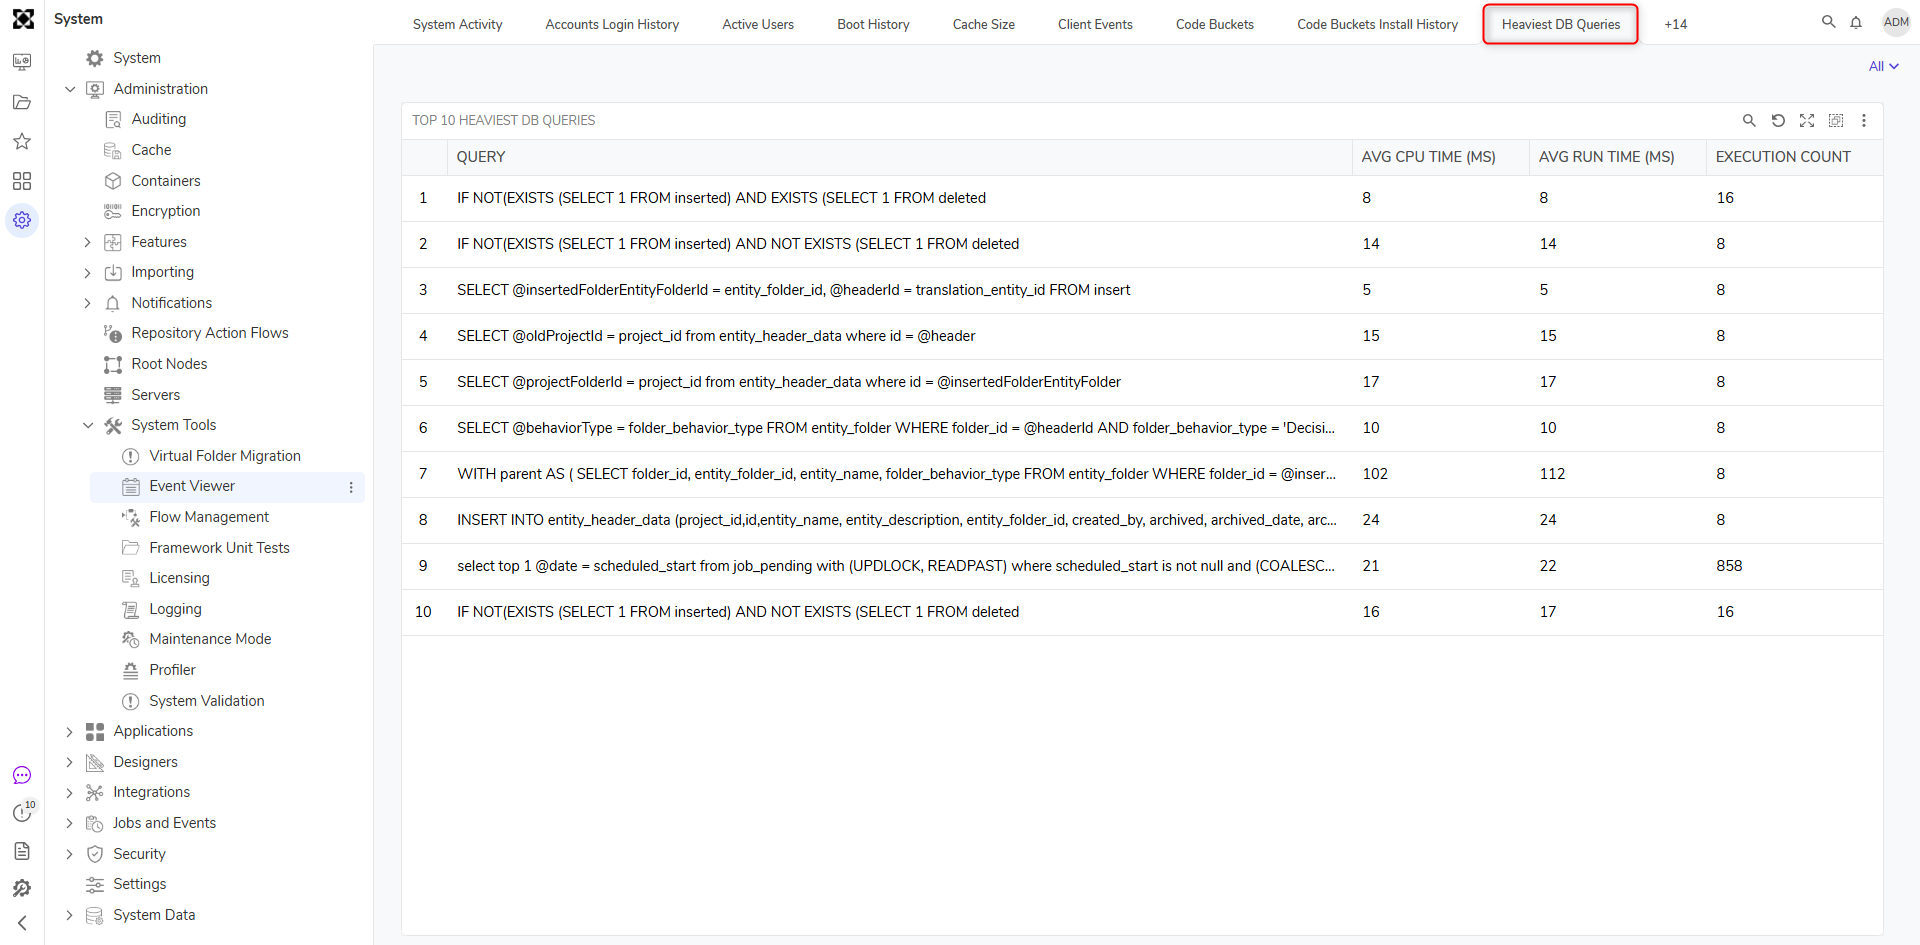
Heaviest DB Queries
Different queries submitted to a database can take up varying amounts of CPU Time and Run Time. The HEAVIEST DB QUERIES Report consolidates and lists the top 10 Heaviest DB Queries, their Average CPU Time, Average Run Time, and the number of times the query was executed (EXECUTION COUNT). To execute these queries, users need special permission to view the server state on the Master DB. Use [master] GO GRANT VIEW SERVER STATE TO [<SpecifyUserName>] GO.
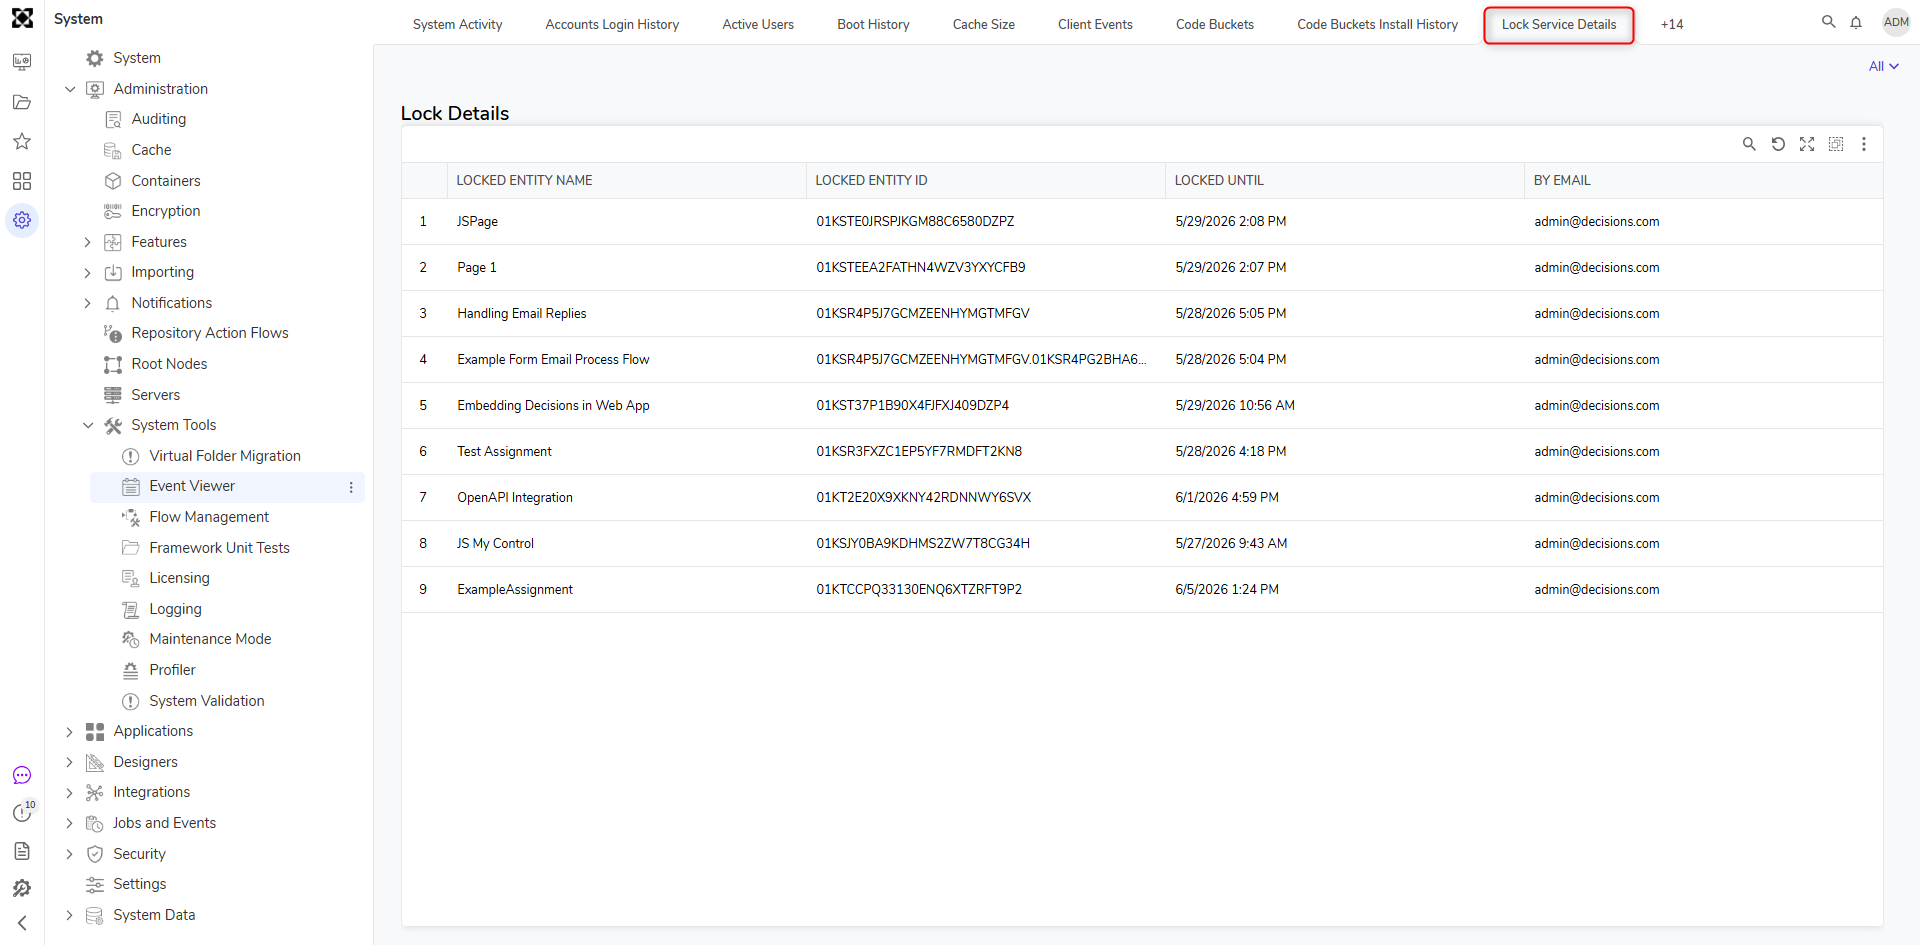
Lock Service Details
The LOCK SERVICE DETAILS Report displays any entity that has been locked (LOCKED ENTITY NAME), the duration of the lock (LOCKED UNTIL), along with the details of who locked it (BY USERID, EMAIL, CLIENTID).
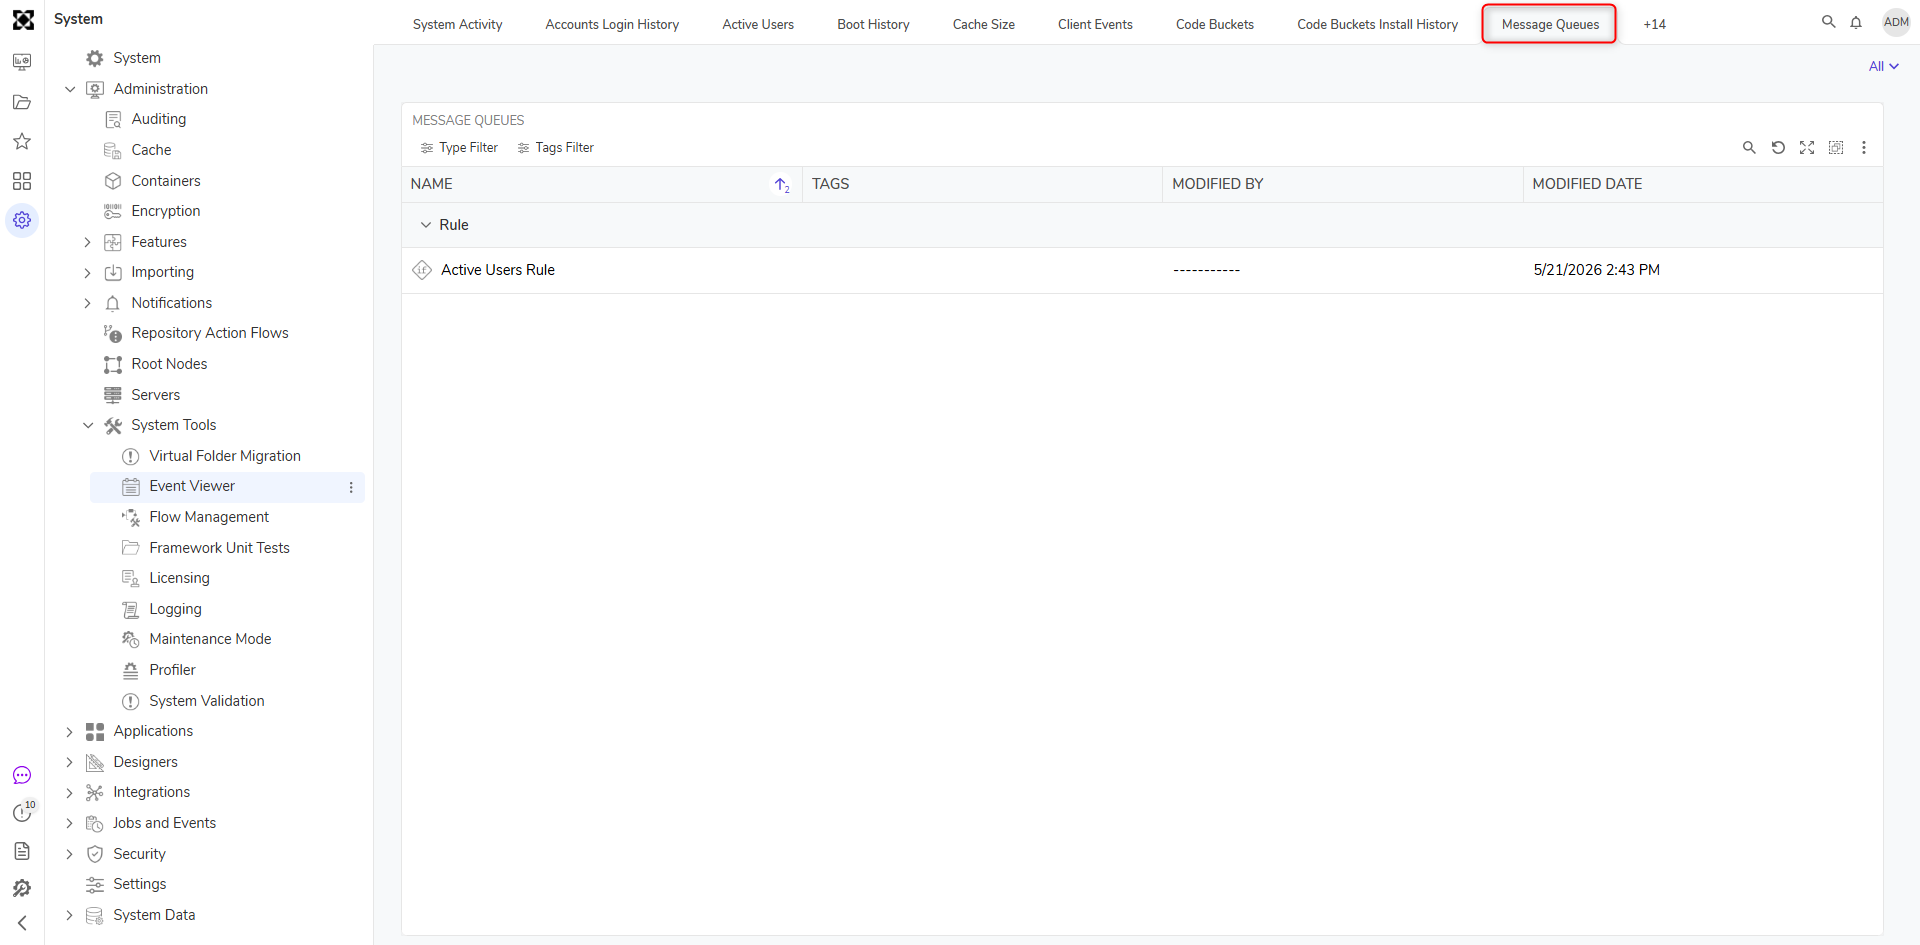
Message Queues
The MESSAGE QUEUES shows the NAME of Message Queues that have been integrated, like RabbitMQ or MSMQ, and how many messages (MESSAGE COUNT) are queued up to process.
Orphan Entities
The ORPHAN ENTITIES Report displays entities that were once in a Folder, but the Folder that contained them has since then been removed.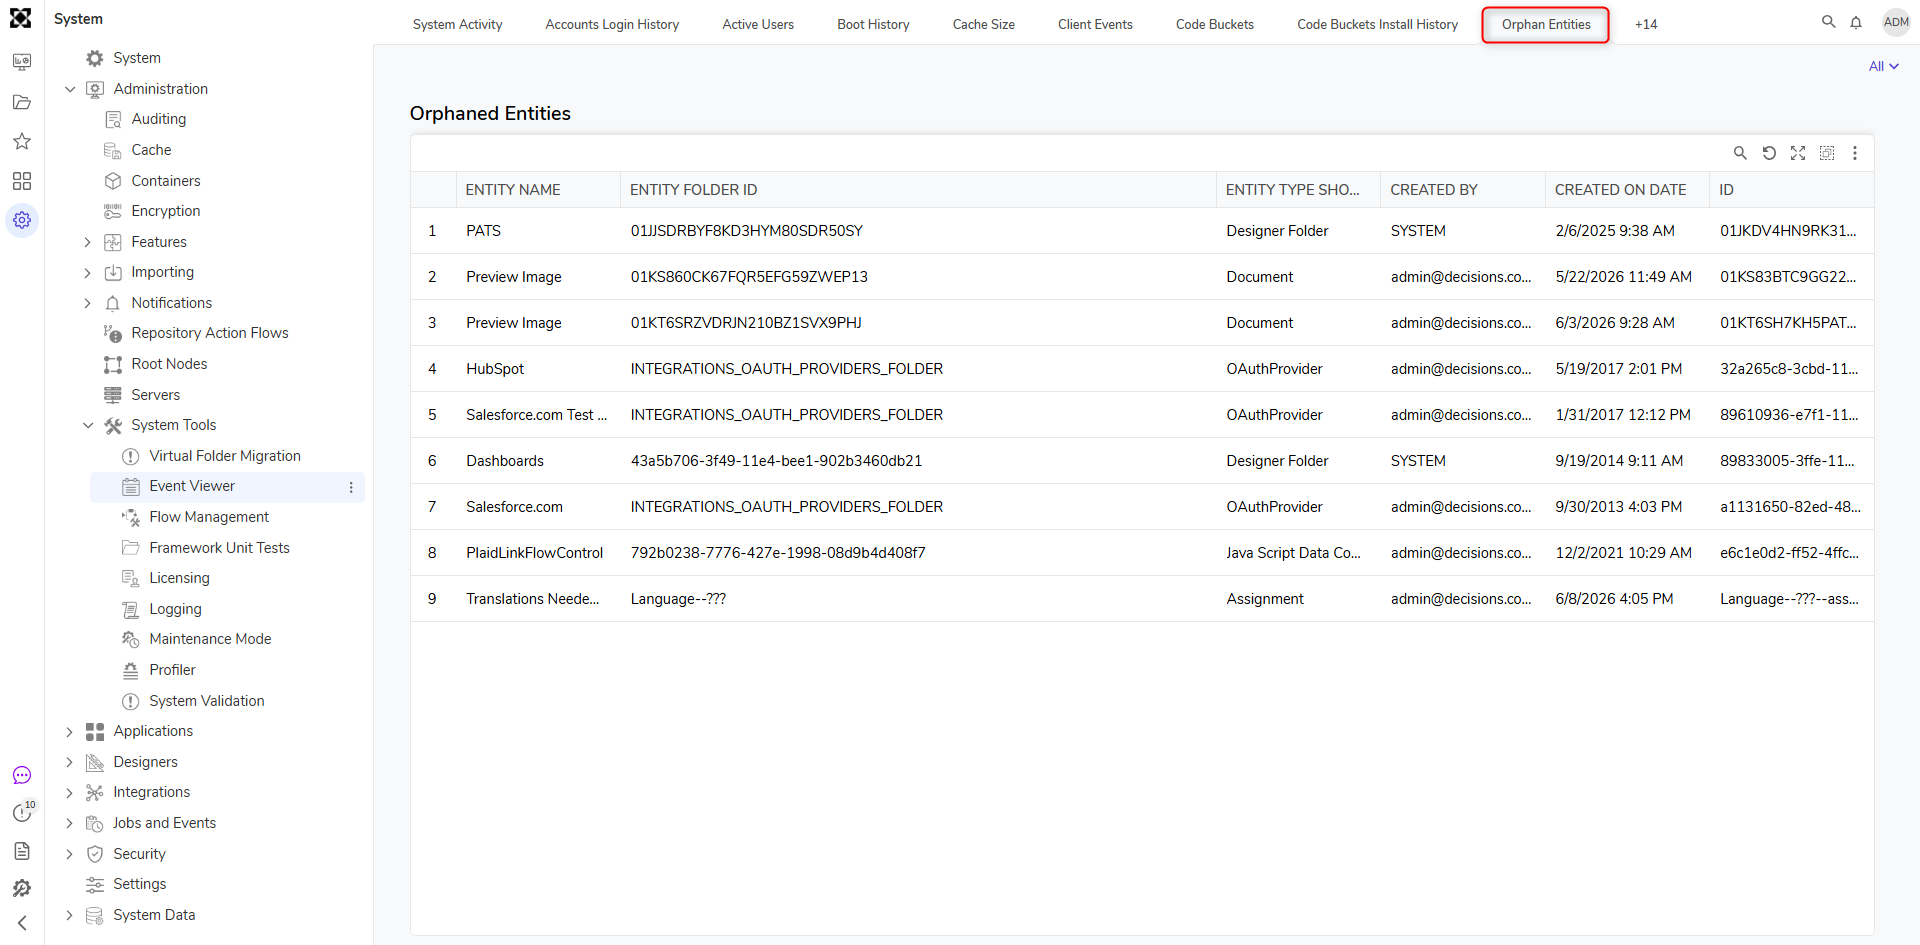
Report Activity
The REPORT ACTIVITY displays a current snapshot of all Reports that are currently being run and in system memory. It includes information such as the Report NAME, REPORT ID, and how much Memory the Report is using (ROWS IN MEMORY).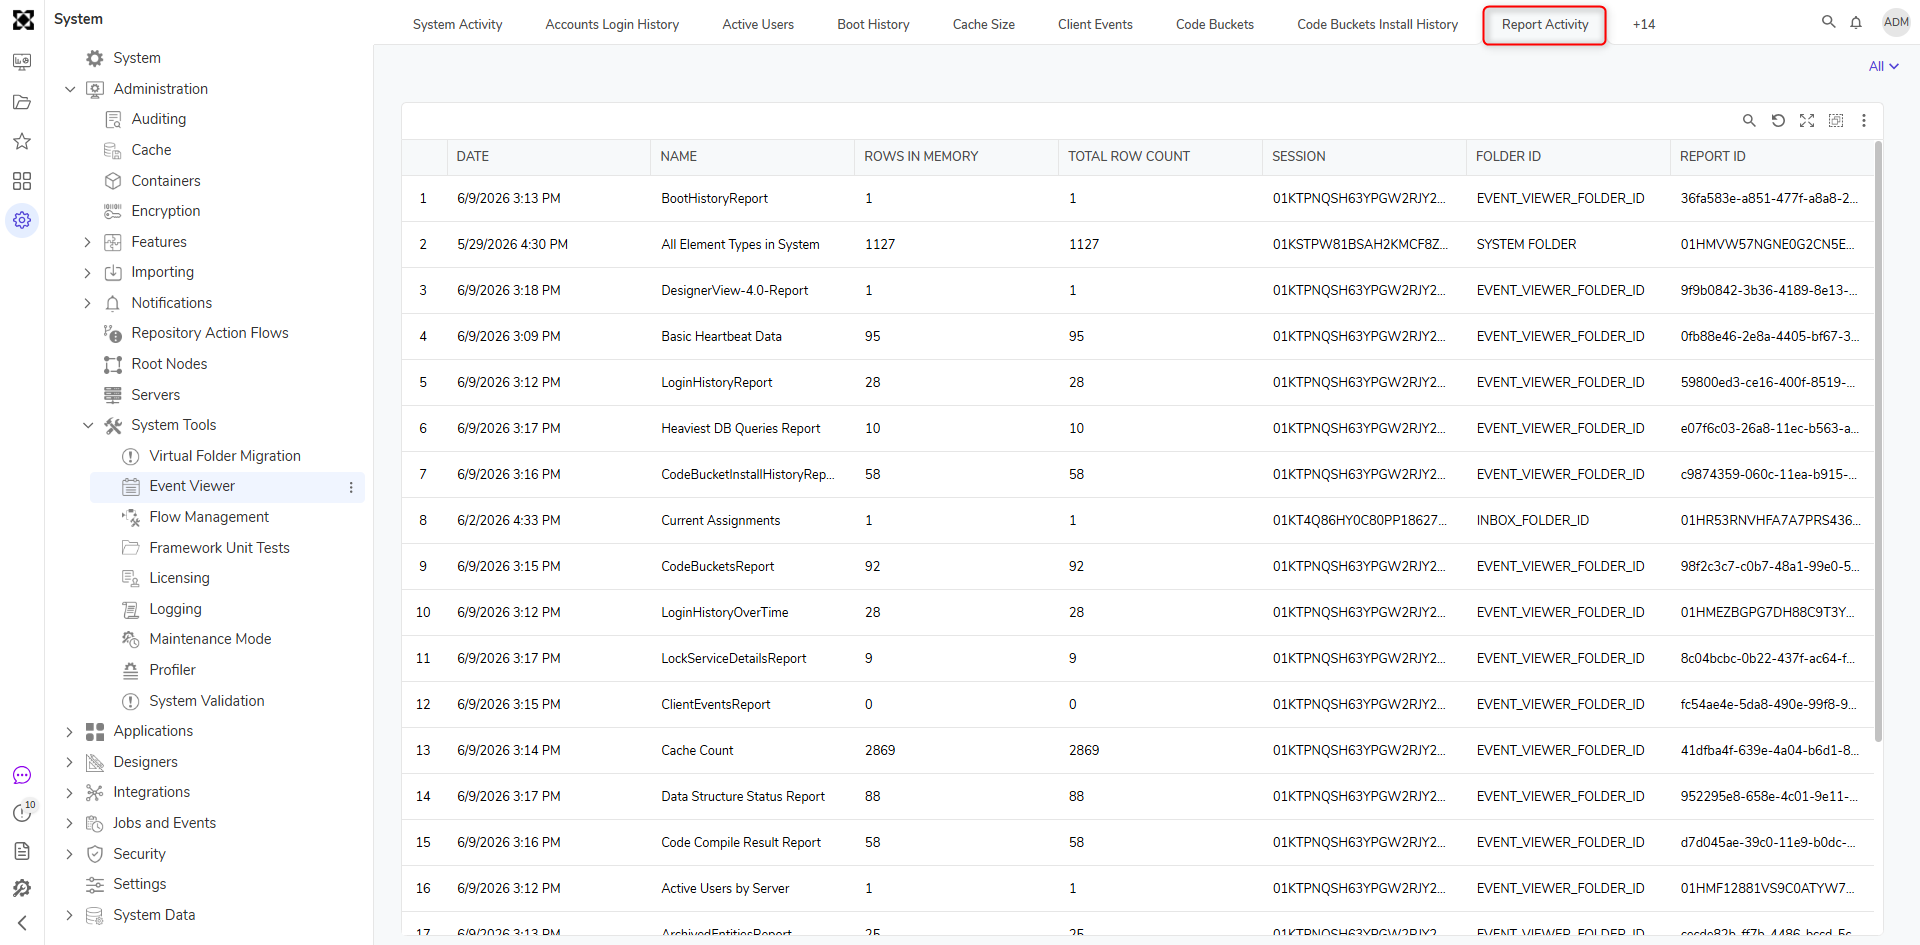
Report Execution Statistics
Though similar to the Report Activity Report above, the REPORT EXECUTION STATISTICS also includes Historical Data from Reports that are no longer in Memory.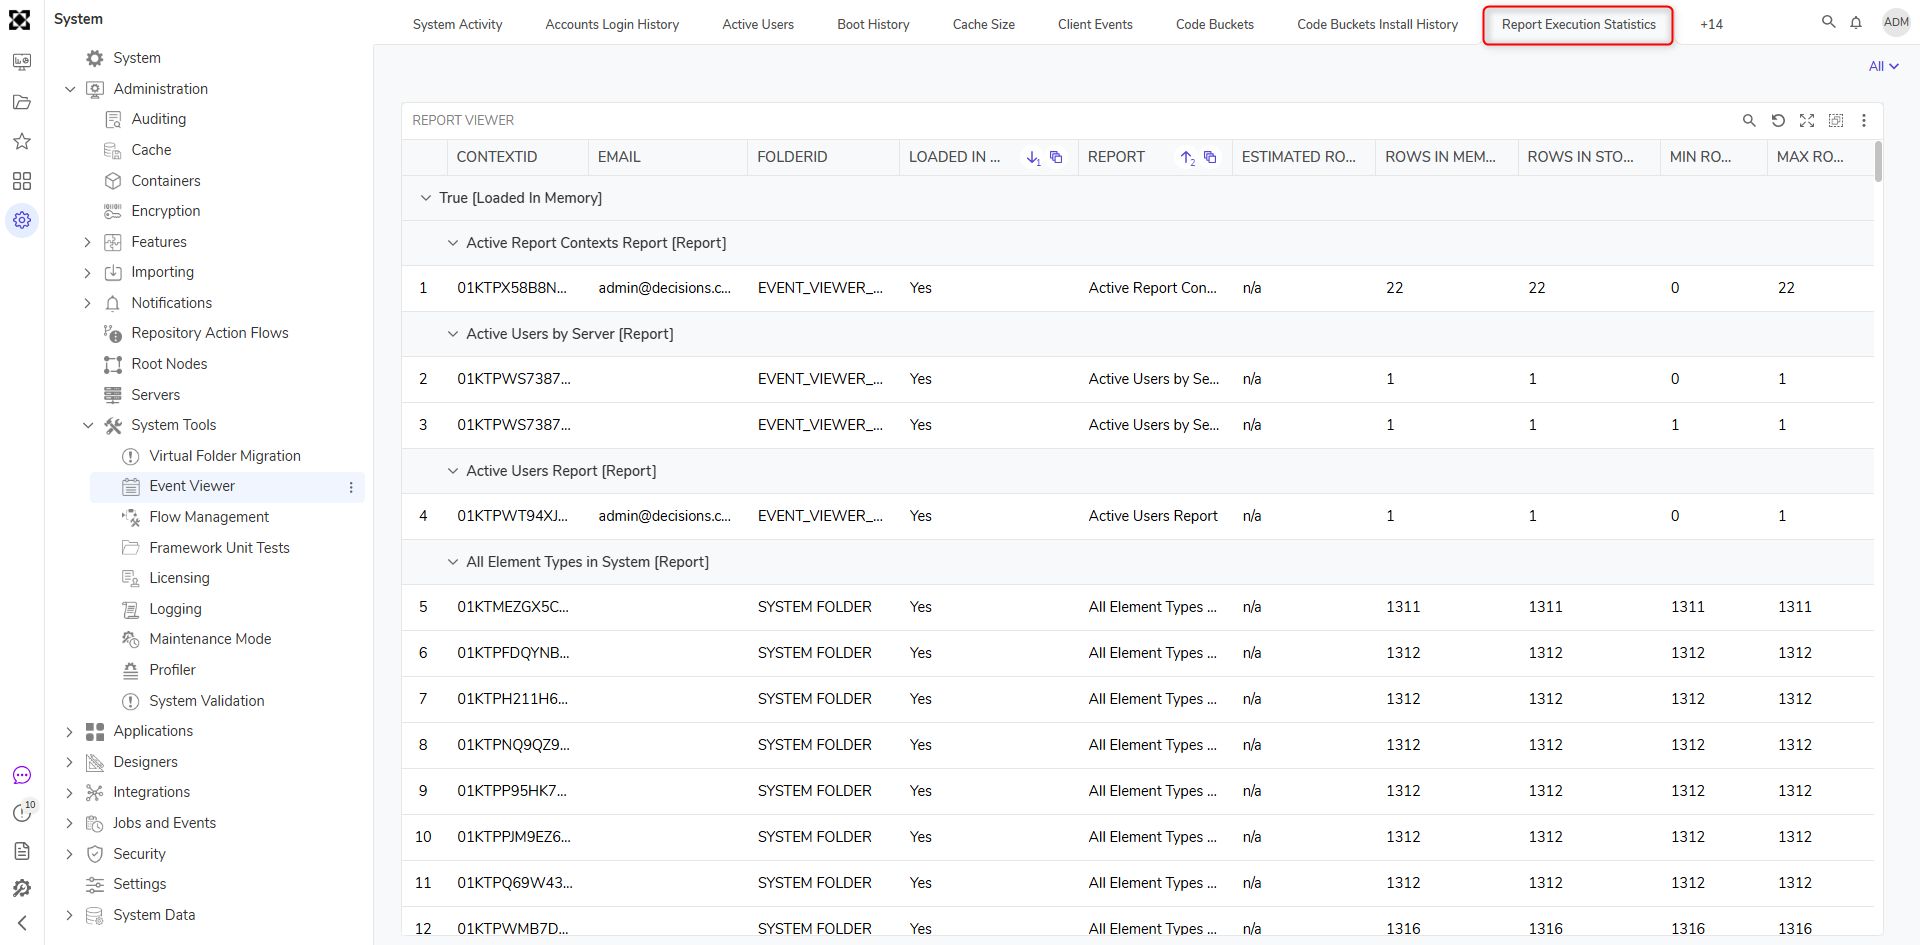
Report Structure
The REPORT STRUCTURE Report contains detailed information on any Report in the Portal. This report includes NAME, ID, TYPE, DATASOURCE NAME, DATASOURCE TYPE, ALL FIELDS, and more.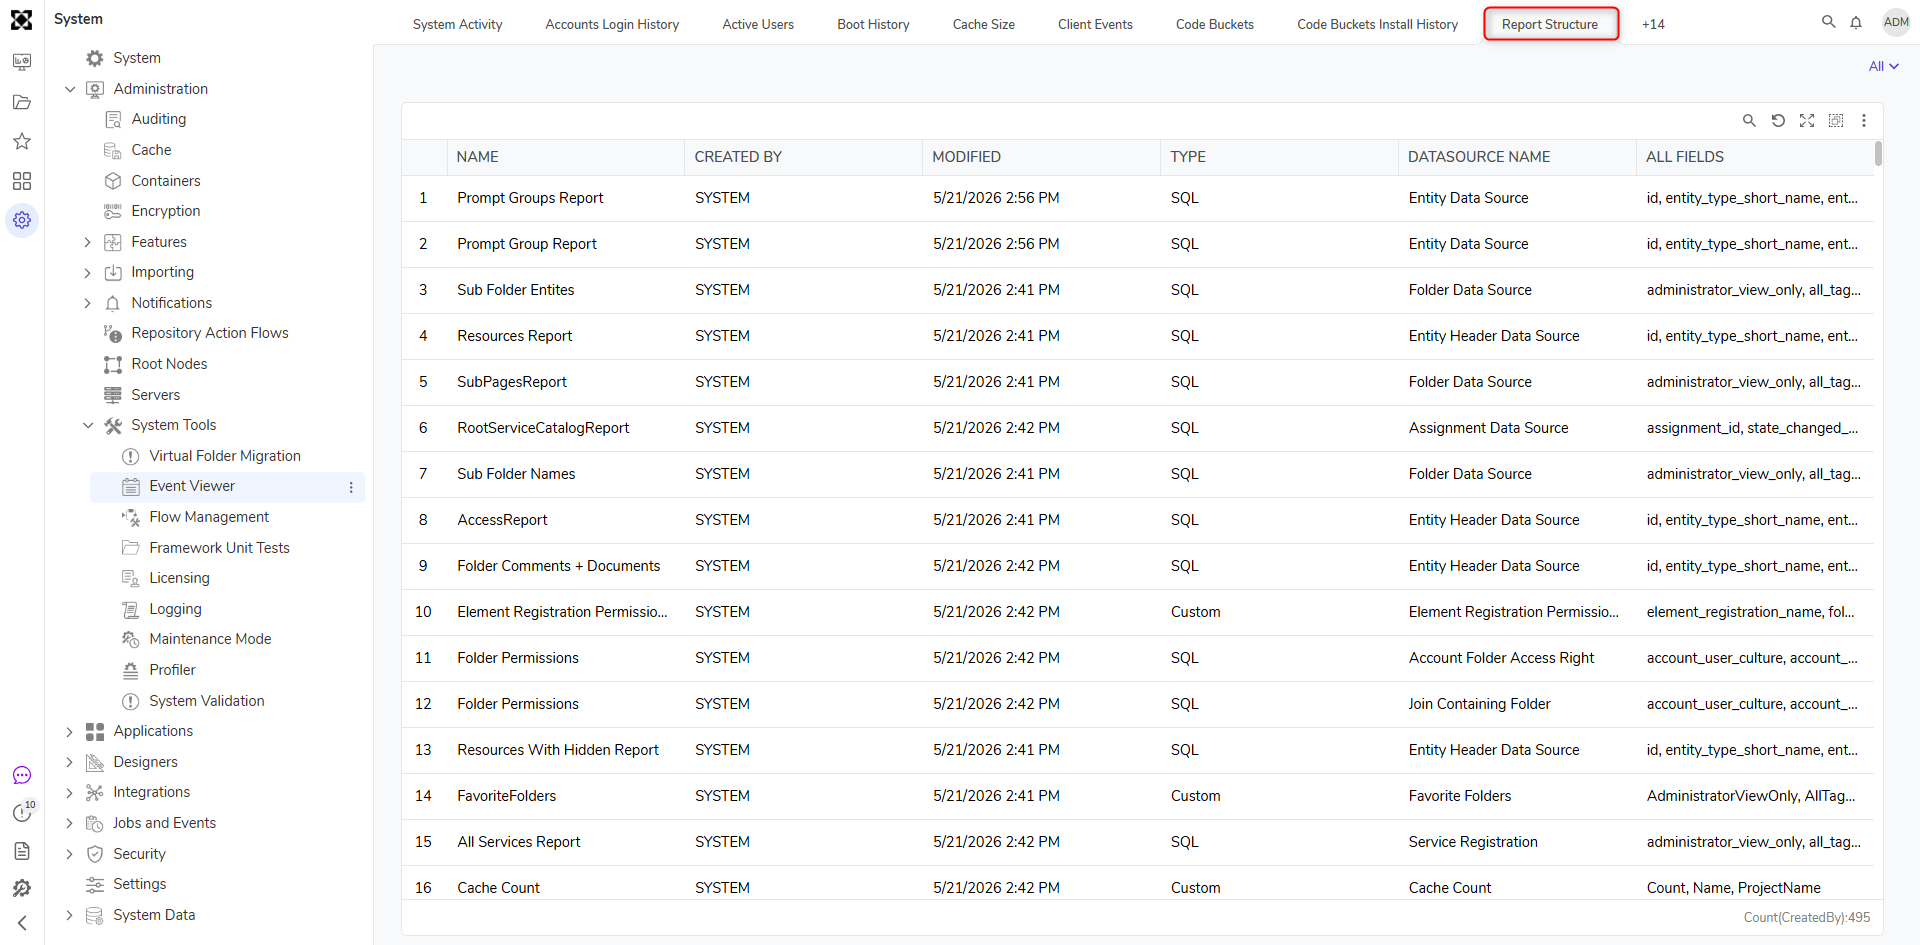
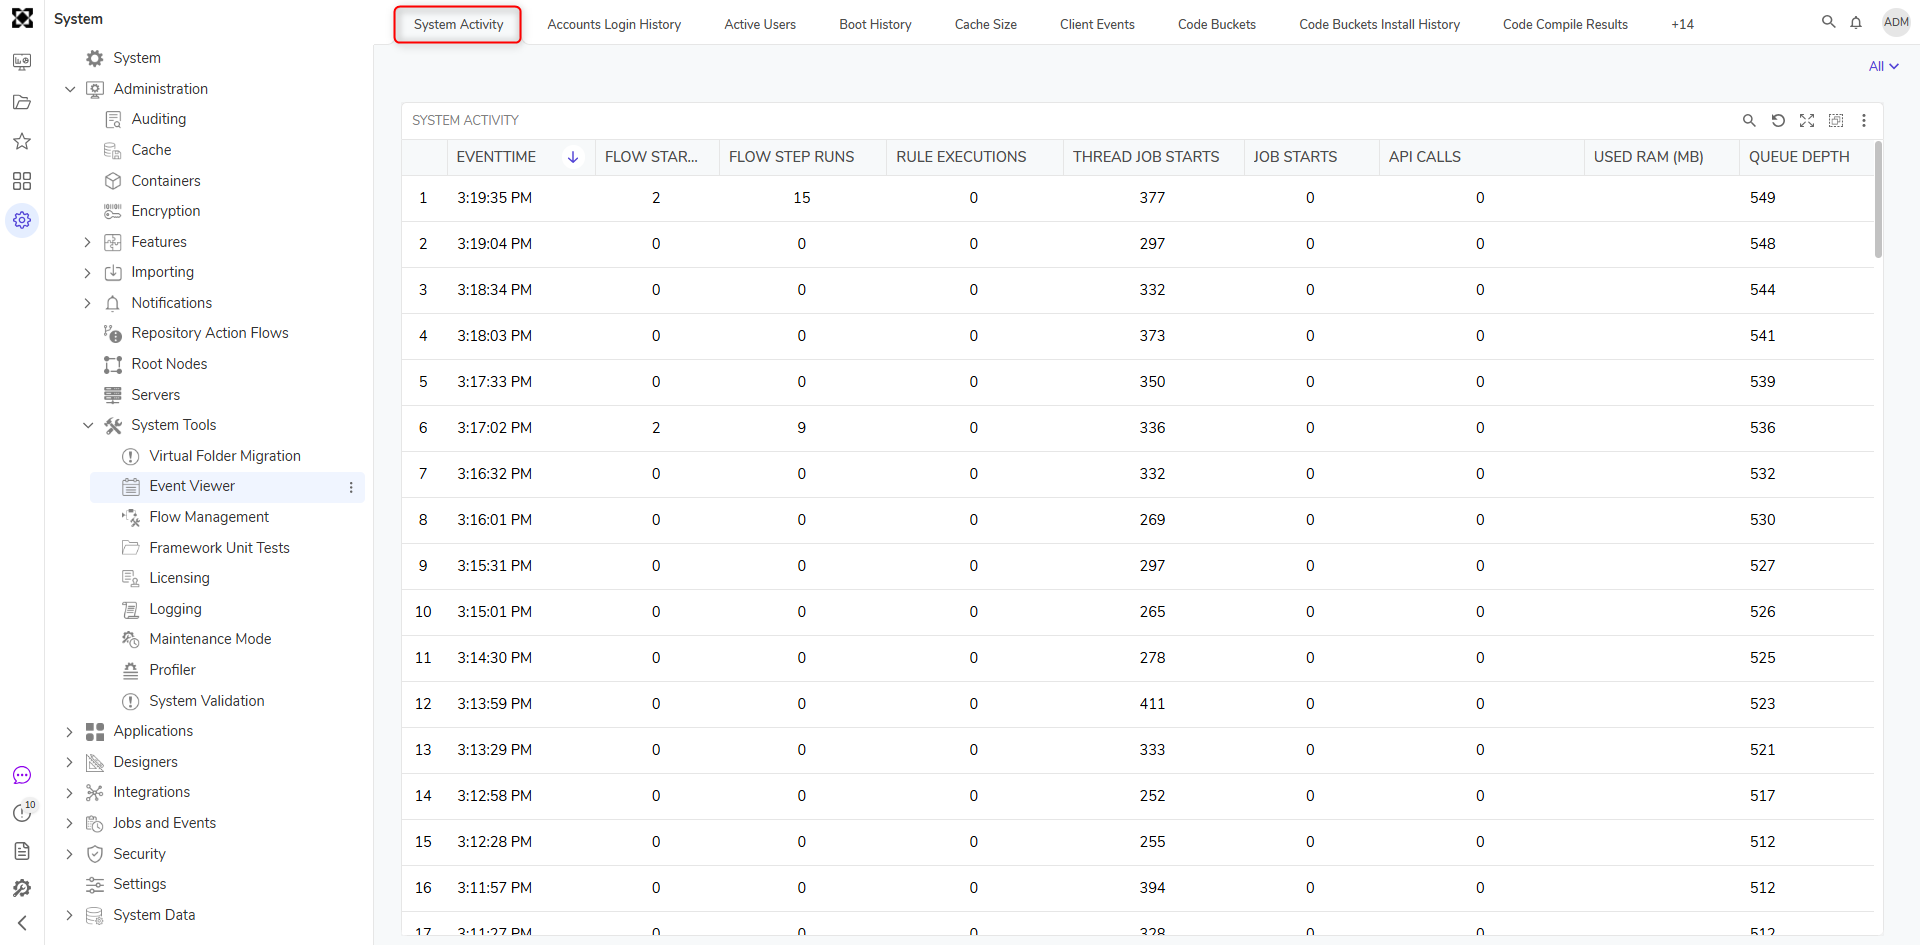
System Activity
The SYSTEM ACTIVITY displays 30-second snapshots of usage statistics (Flows, Steps, Rules, Jobs, API Calls, and RAM) inside the Portal.
Thread Jobs Report
The THREAD JOBS Report displays all the Active Thread Job pools and their corresponding Queued Jobs. Within each Thread Queue (QUEUENAME), there is an action to Run Now or Clear Job. 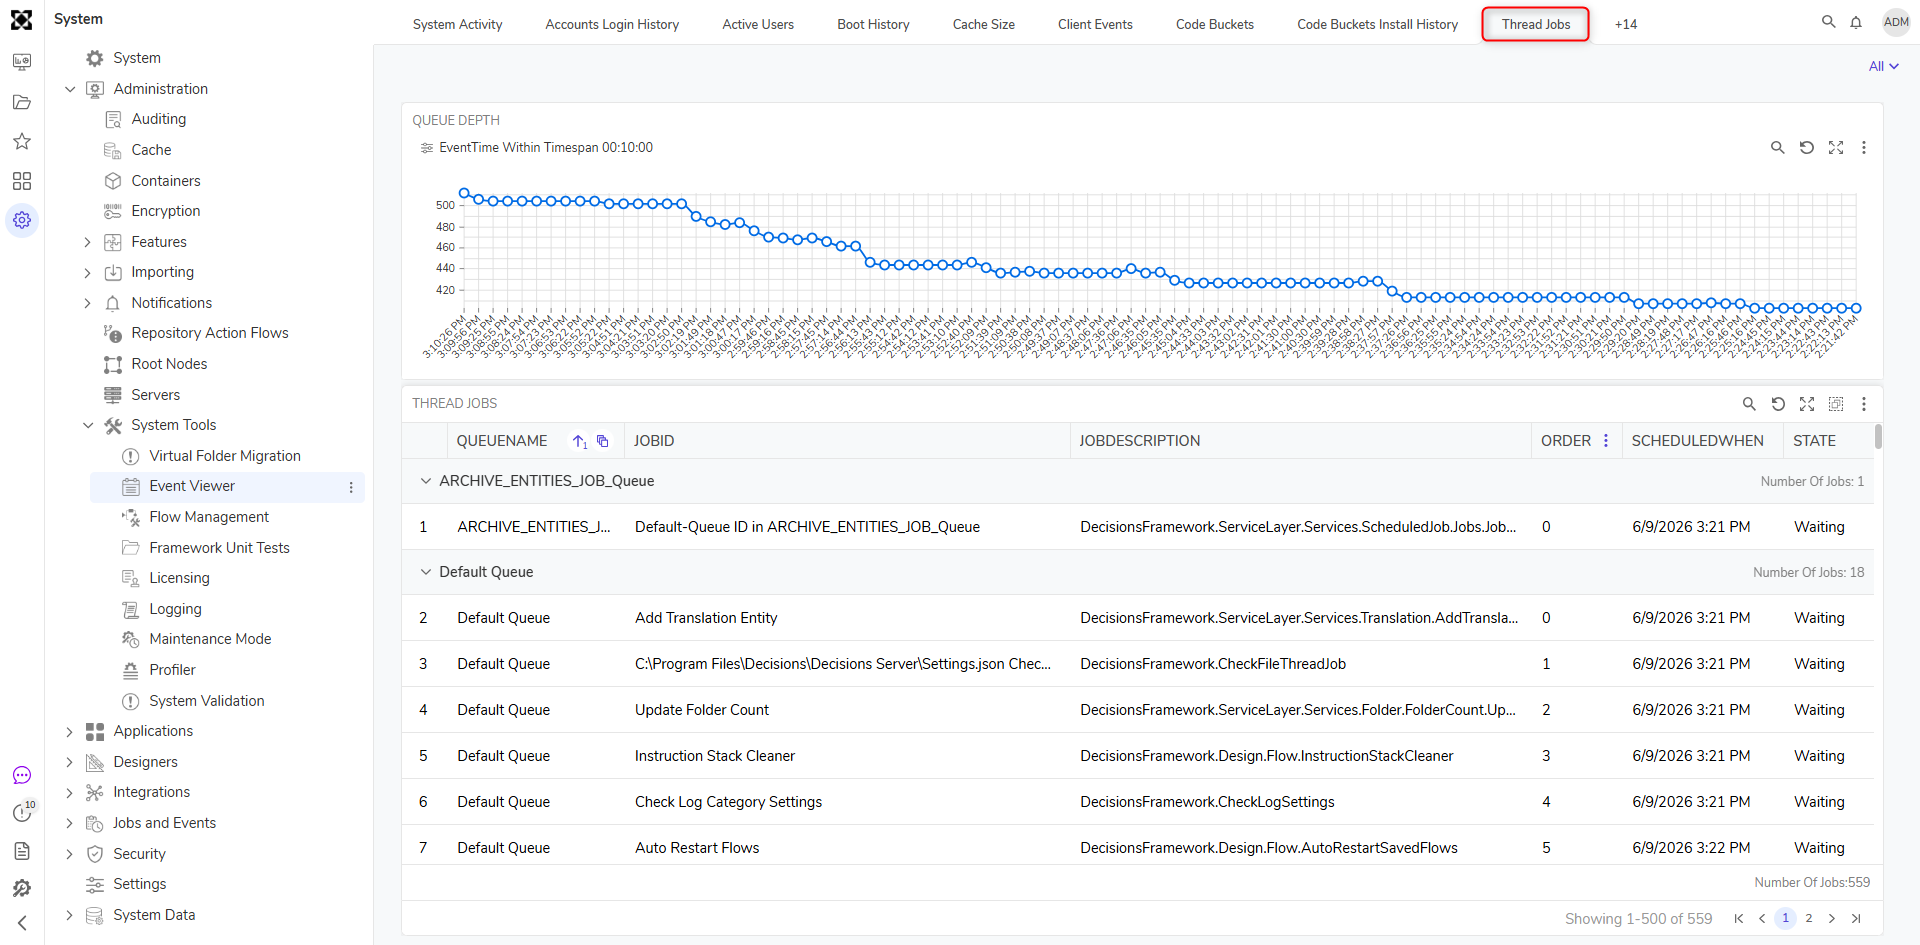
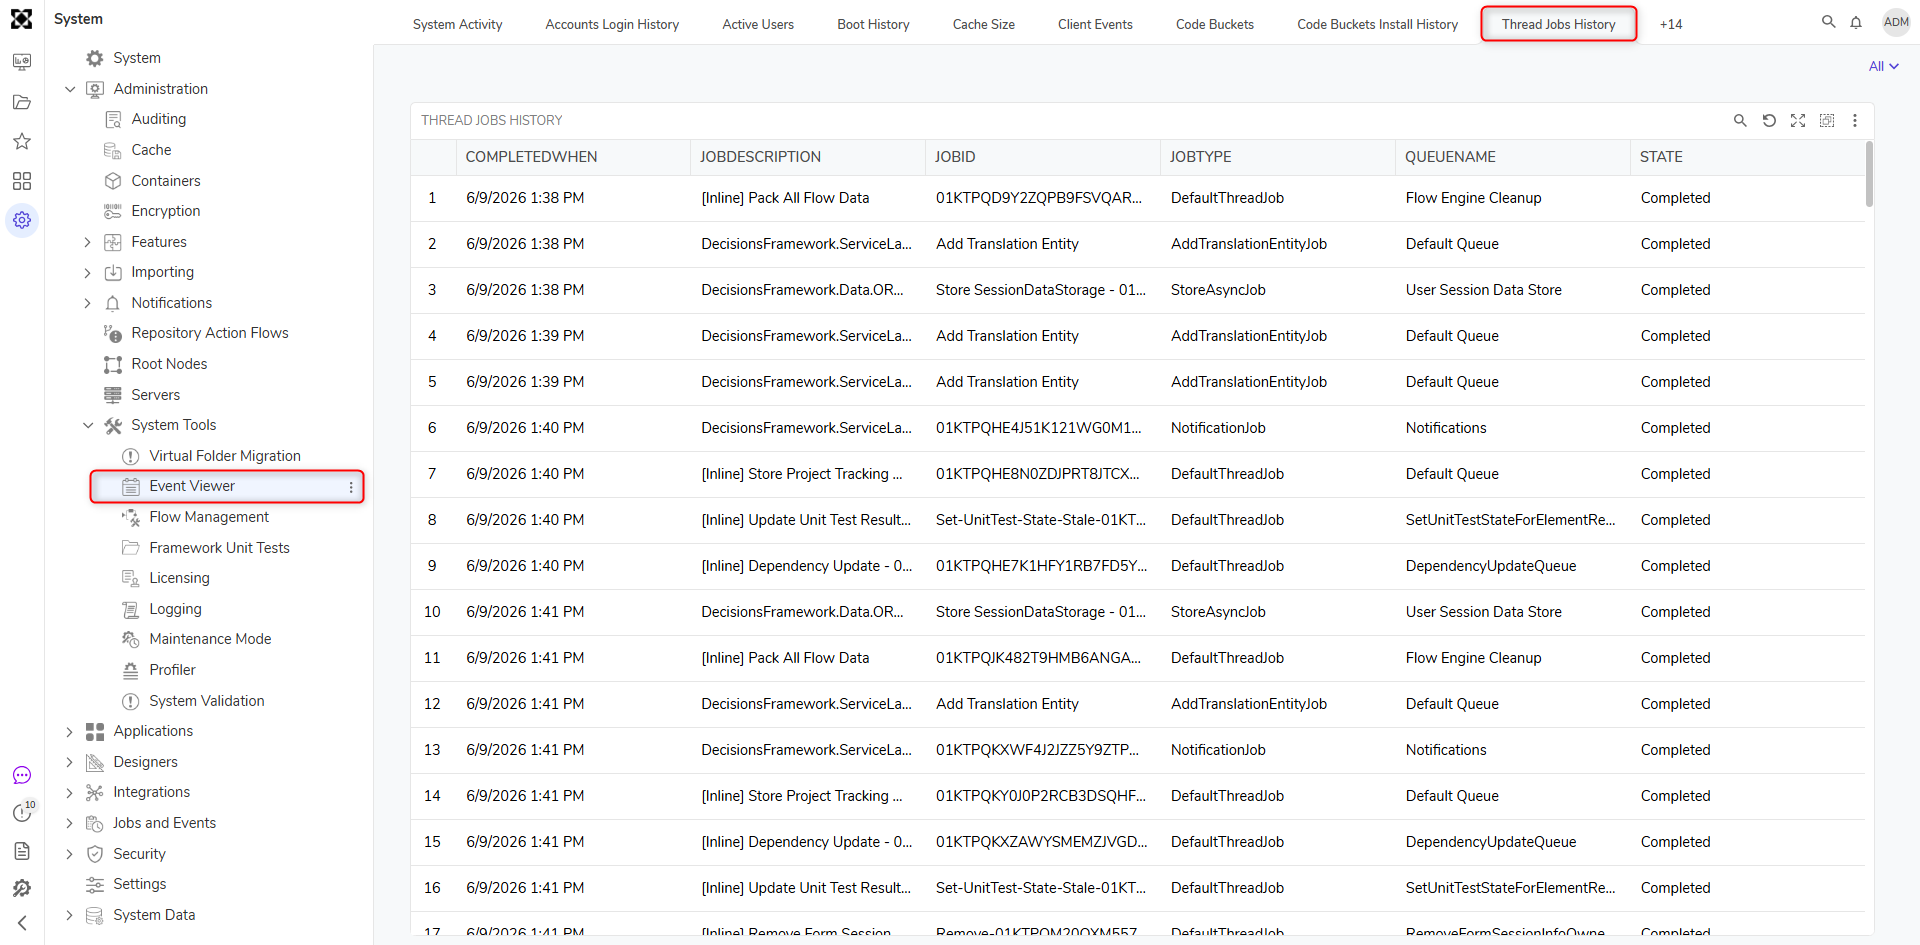
Thread Jobs History
The THREAD JOB HISTORY report displays a log of Thread Jobs that have run within the past, including when each job completed, what it did, and which Queue handled it. It’s primarily used to monitor thread job activity, confirm successful execution of tasks, and troubleshoot job-related issues.
Upgrade History Report
The UPGRADE HISTORY Report displays the DateTime of the Verision (VERSION DATE) along with the Version number (VERSION LABEL).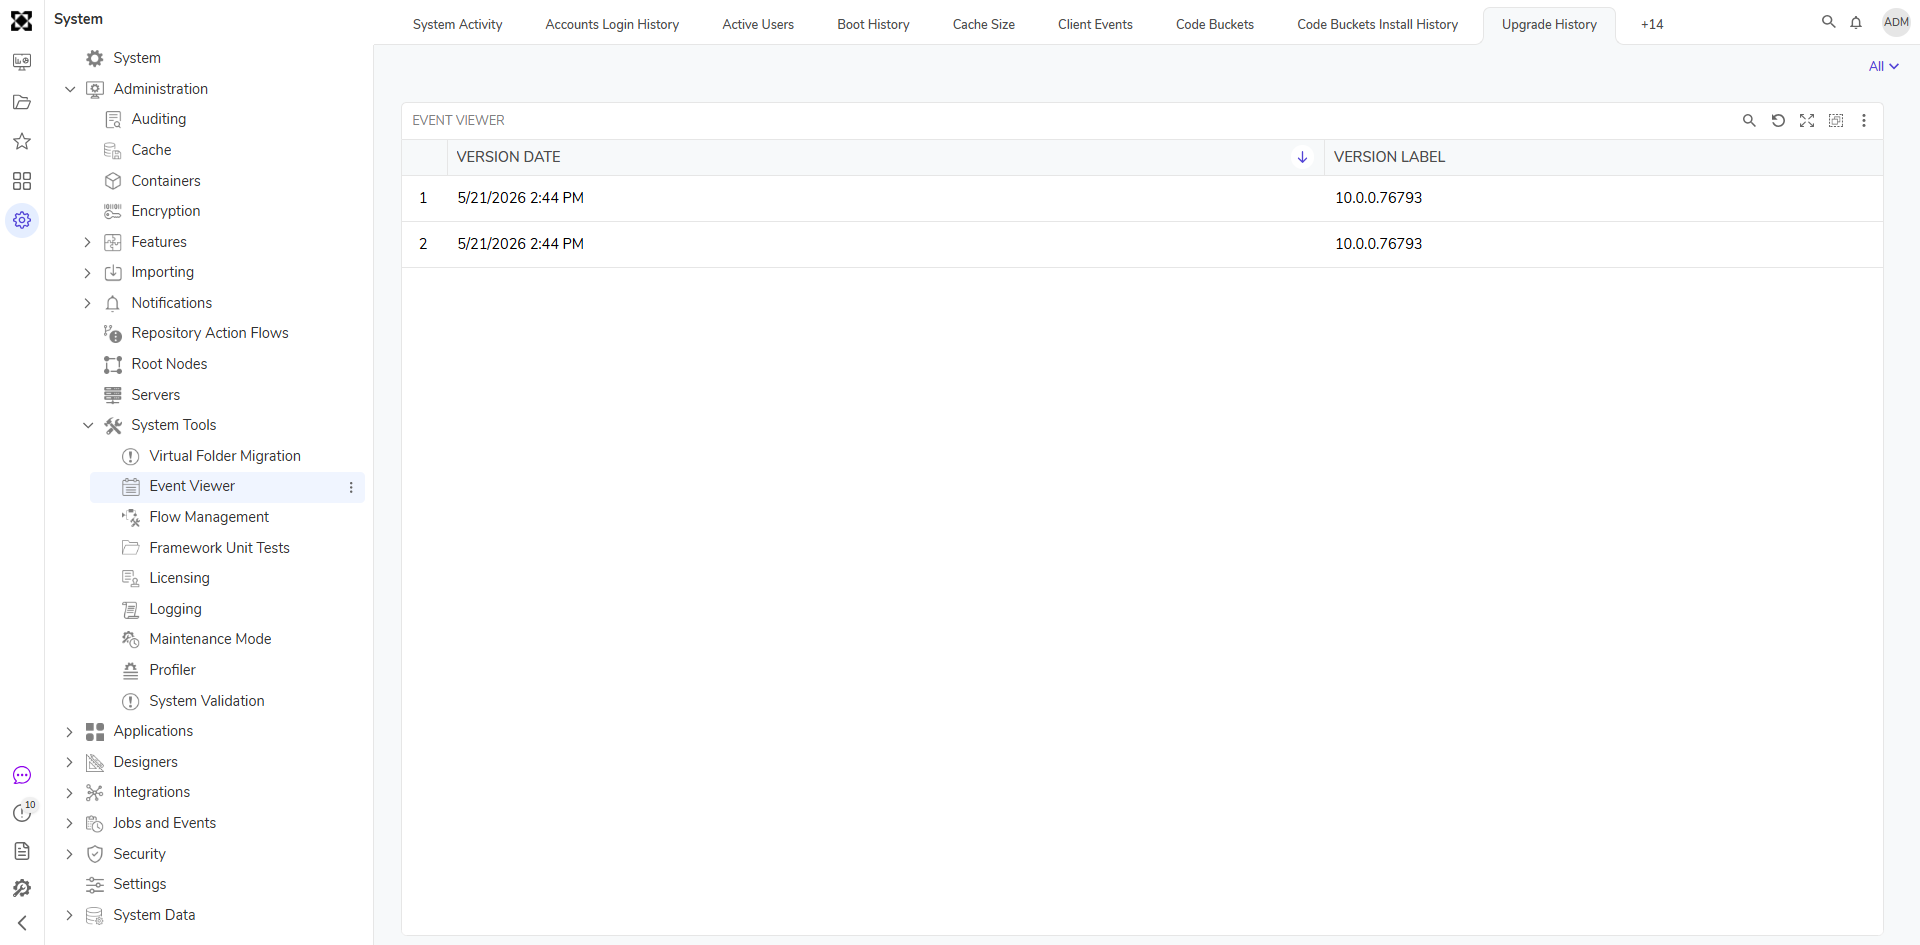
Feature Changes
| Description | Version | Release Date | Developer Task |
|---|---|---|---|
| Added Thread Job History Report | 9.10 | May 2025 | [DT-043897] |
| Added the Show Details action and window to the Event Viewer. | 9.9 | April 2025 | [DT-043696] |