Overview
This article highlights all the enhancements to the Flow Debugger that will be available to users starting with v9.11. Below is a breakdown of each enhancement over multiple releases.
Ability to Truncate Log Strings (v9.16)
If the text in the Flow Debugger's inspection dialog exceeds 2,000 characters, a 'See More' link will be displayed. This link will be displayed for every 2,000 characters. A 'See Less' link will be displayed once all characters have been expanded.
Ability to Open Debug Execution of Child Entities (v9.15)
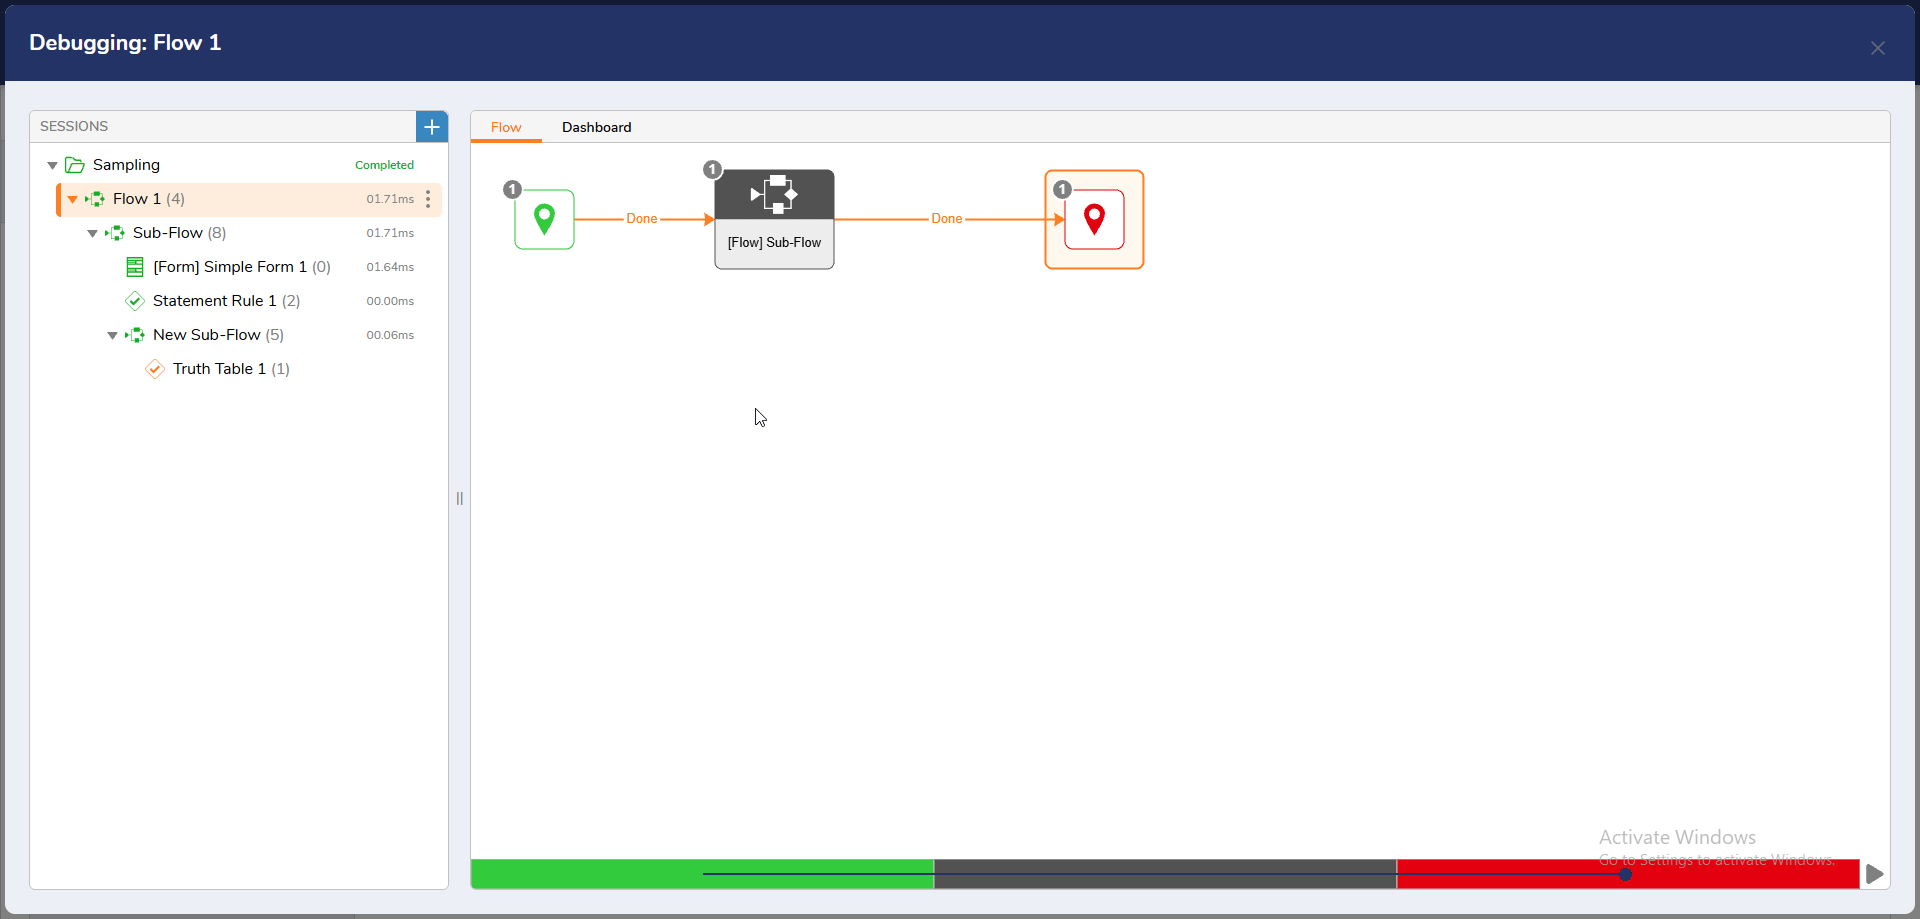
In the Flow Debugger, we have added a new icon beneath Steps that reference sub-entities (e.g., Flows, Rules, Forms). Clicking this icon allows users to open and inspect the debug execution of those sub-entities directly from the Debug Canvas. This enhancement makes it easier to drill down into nested executions without having to scroll through the Debug Tree.
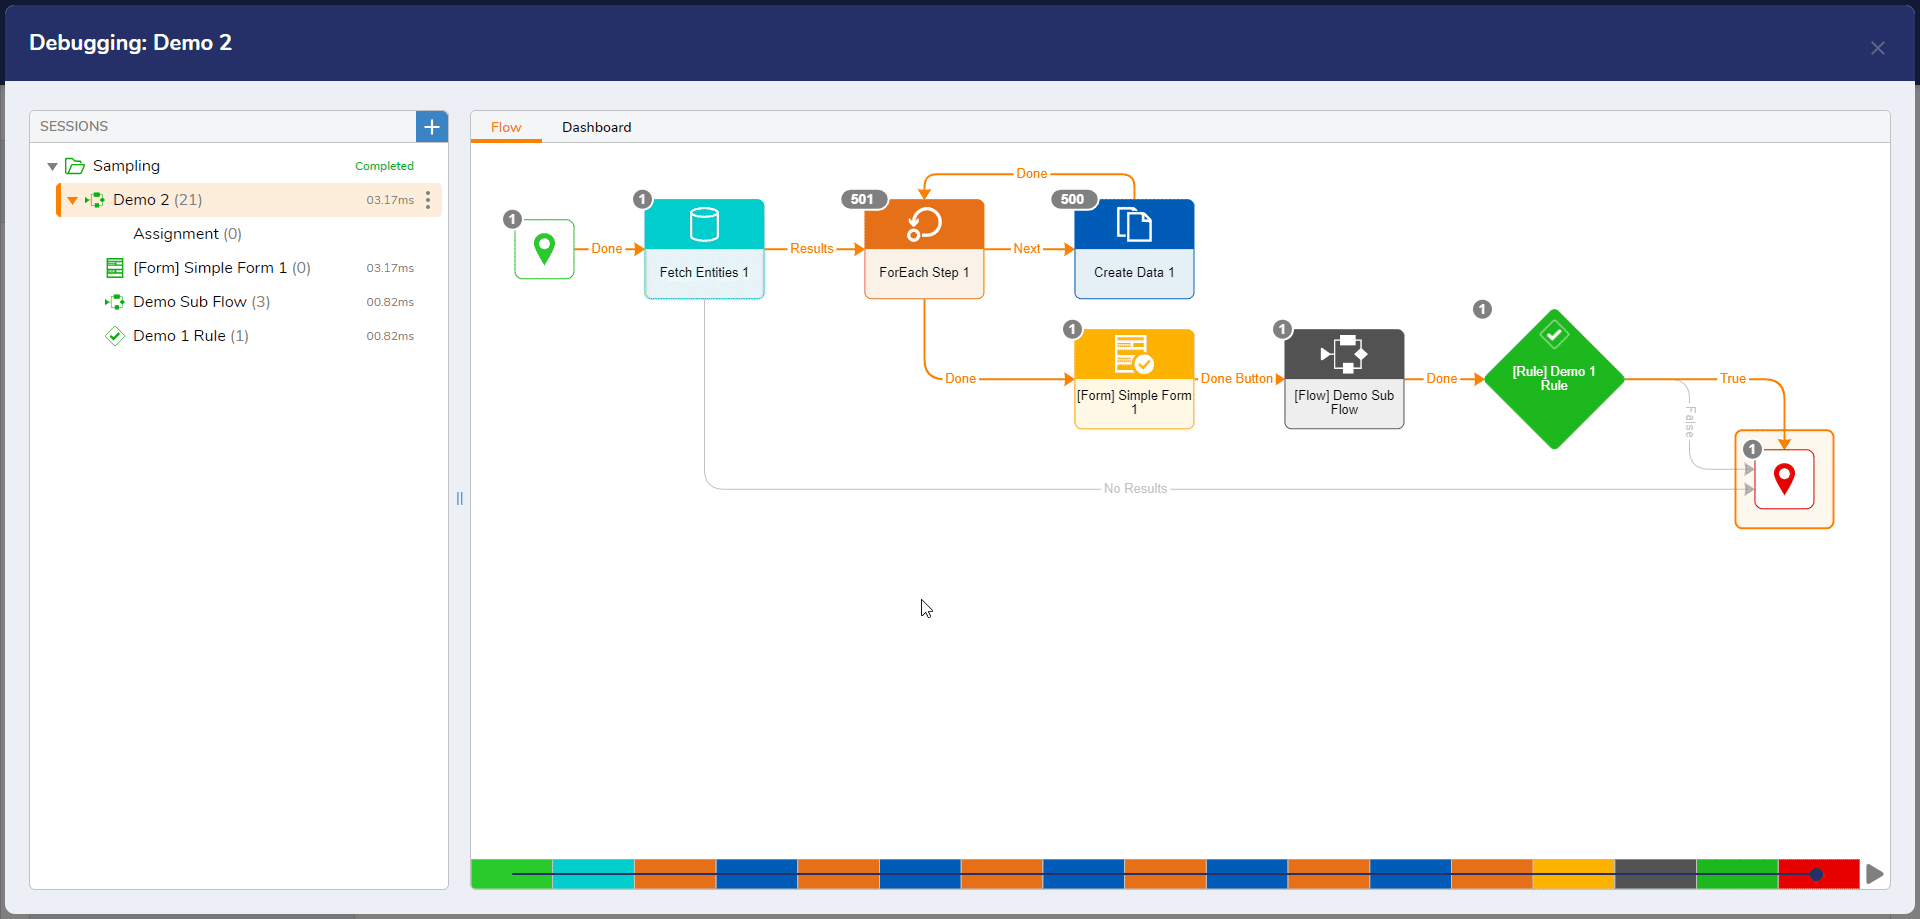
Viewing Data for Each Outcome Path (v9.14)
In cases where a step has multiple outcome paths and the Flow runs through a loop, it may take different paths in each iteration. Previously, users could not view data specific to a particular outcome path. In v9.14, users can now hover over the step to see how many times each path was taken and view the data associated with that specific path by clicking on the counter seen on the path.
In the following example, the Rule step executes 1,457 times, with the Flow taking the True path 520 times and the False path 937 times. Users can click on each counter to view the data specific to that path.
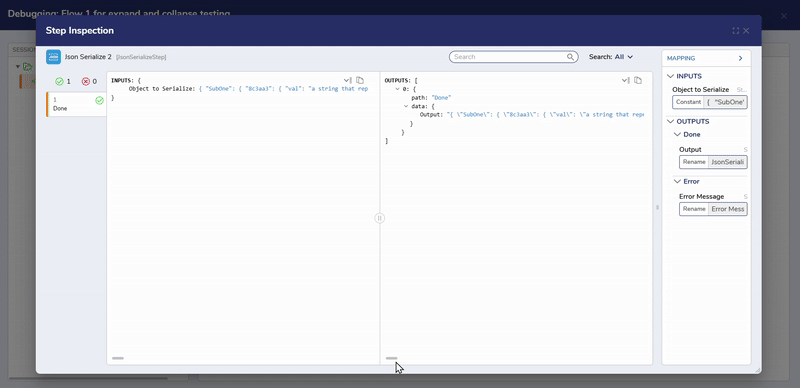
Ability to Expand and Collapse JSON Objects in Inspection Dialog (v9.14)
Two new icons have been added to the Step Inspection dialog, allowing users to expand or collapse all JSON objects at once. Clicking the Collapse icon will collapse all JSON objects across every node, while clicking the Expand icon will fully expand them.
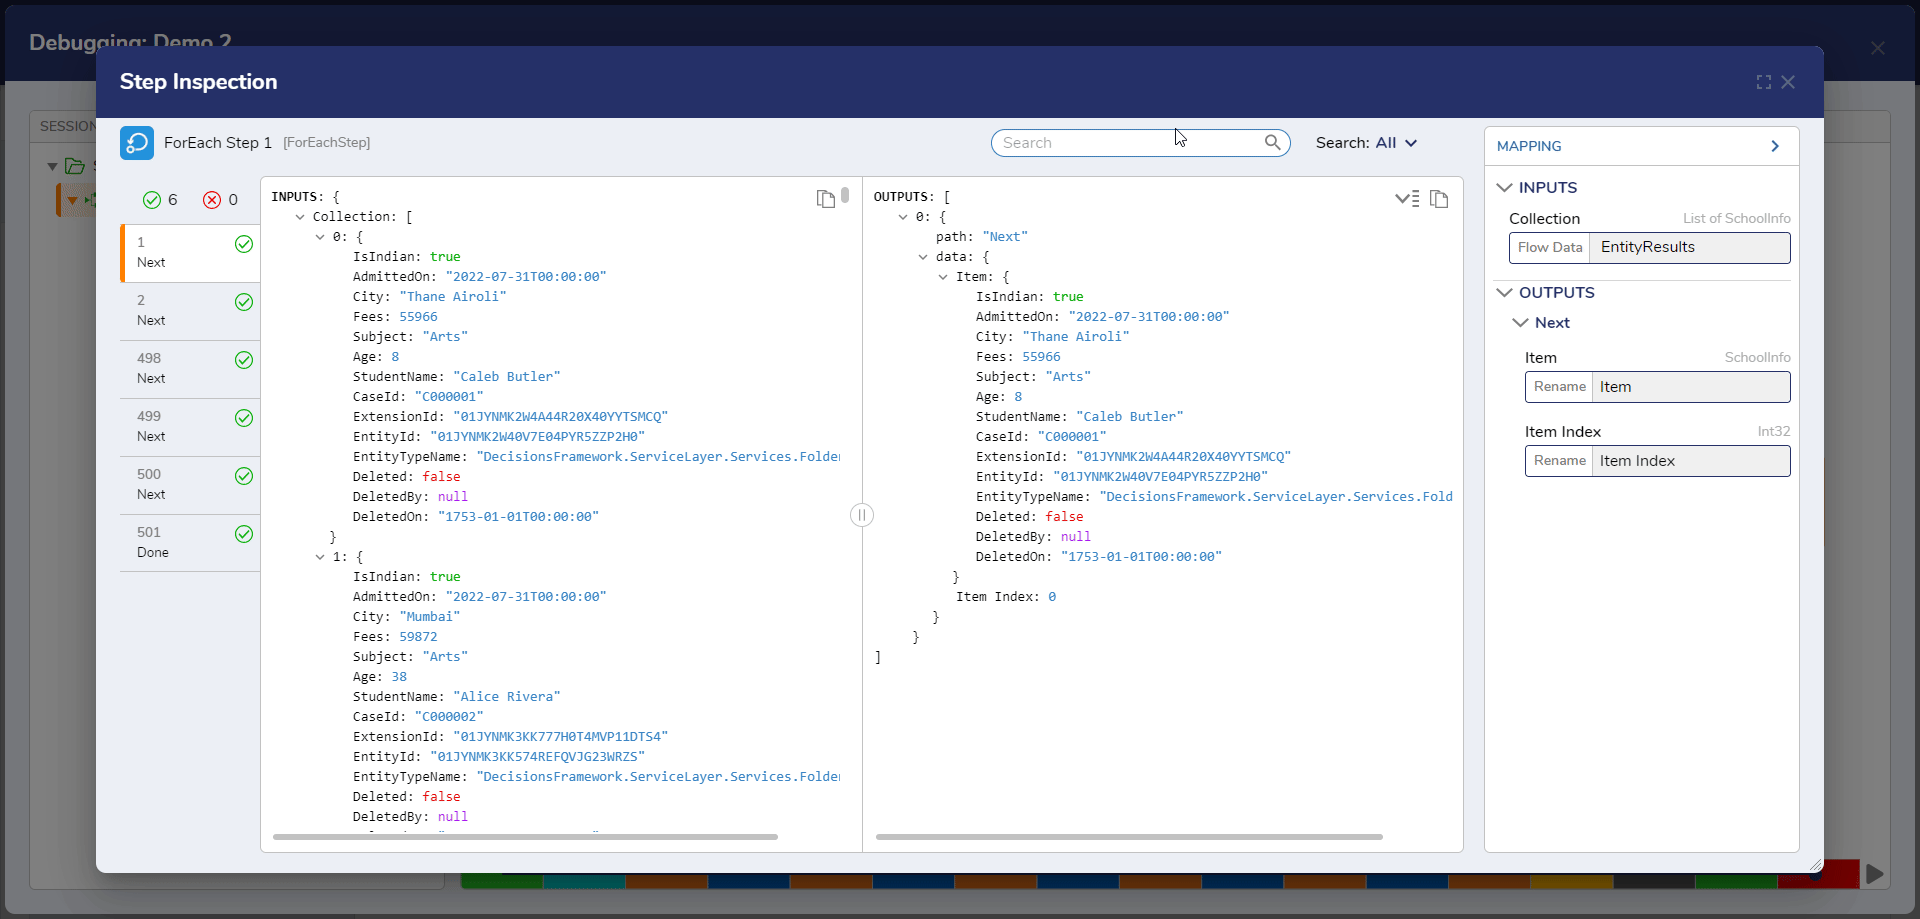
Improved Search in Inspection dialog (v9.13)
In v9.13, we made a more unified way to search in the inspection dialog.
Users have the option to search within All, Inputs, or Outputs when using the search bar in the inspection dialog. Selecting "All" allows the users to search through both inputs and outputs of each execution, while selecting "Inputs" or "Outputs" restricts the search to just those respective sections. Once a user enters text into the search bar, the data gets filtered to show the matching text from the selected section(s) across all executions. This also includes filtering the list of executions or iterations on the left.
Note: If any matching results are not found from an iteration, the iteration will filter out, and users will see no search results.
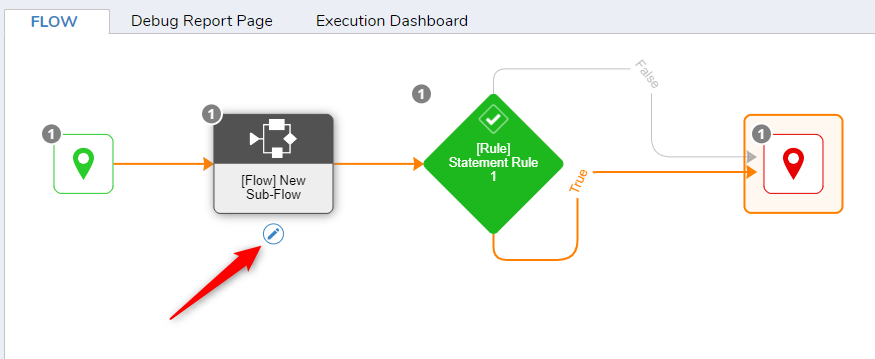
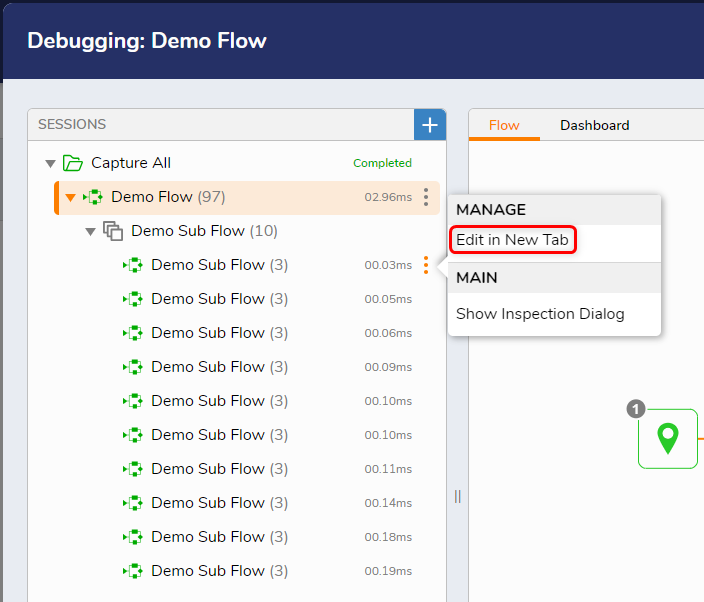
Edit Entities from Debugger (v9.13)
While debugging a Flow, users might encounter a step, sub-flow, or referenced entity that requires modification. Starting with v9.12, the "Edit in New Tab" option enables users to open the selected item directly in a new browser tab, eliminating the need to navigate away from the Debugger manually.
There are three ways users can use this action:
- On Steps: Users can click the pencil icon available on all sub-entity steps, which opens the corresponding entity in a new tab for editing.
- On Step Inspection Dialog: A button at the bottom of the inspection dialog allows users to open and edit the entity in a new tab.
- In Debugger Tree: When right-clicking on the Debugger Tree, users will also see the 'Edit in New Tab' option.
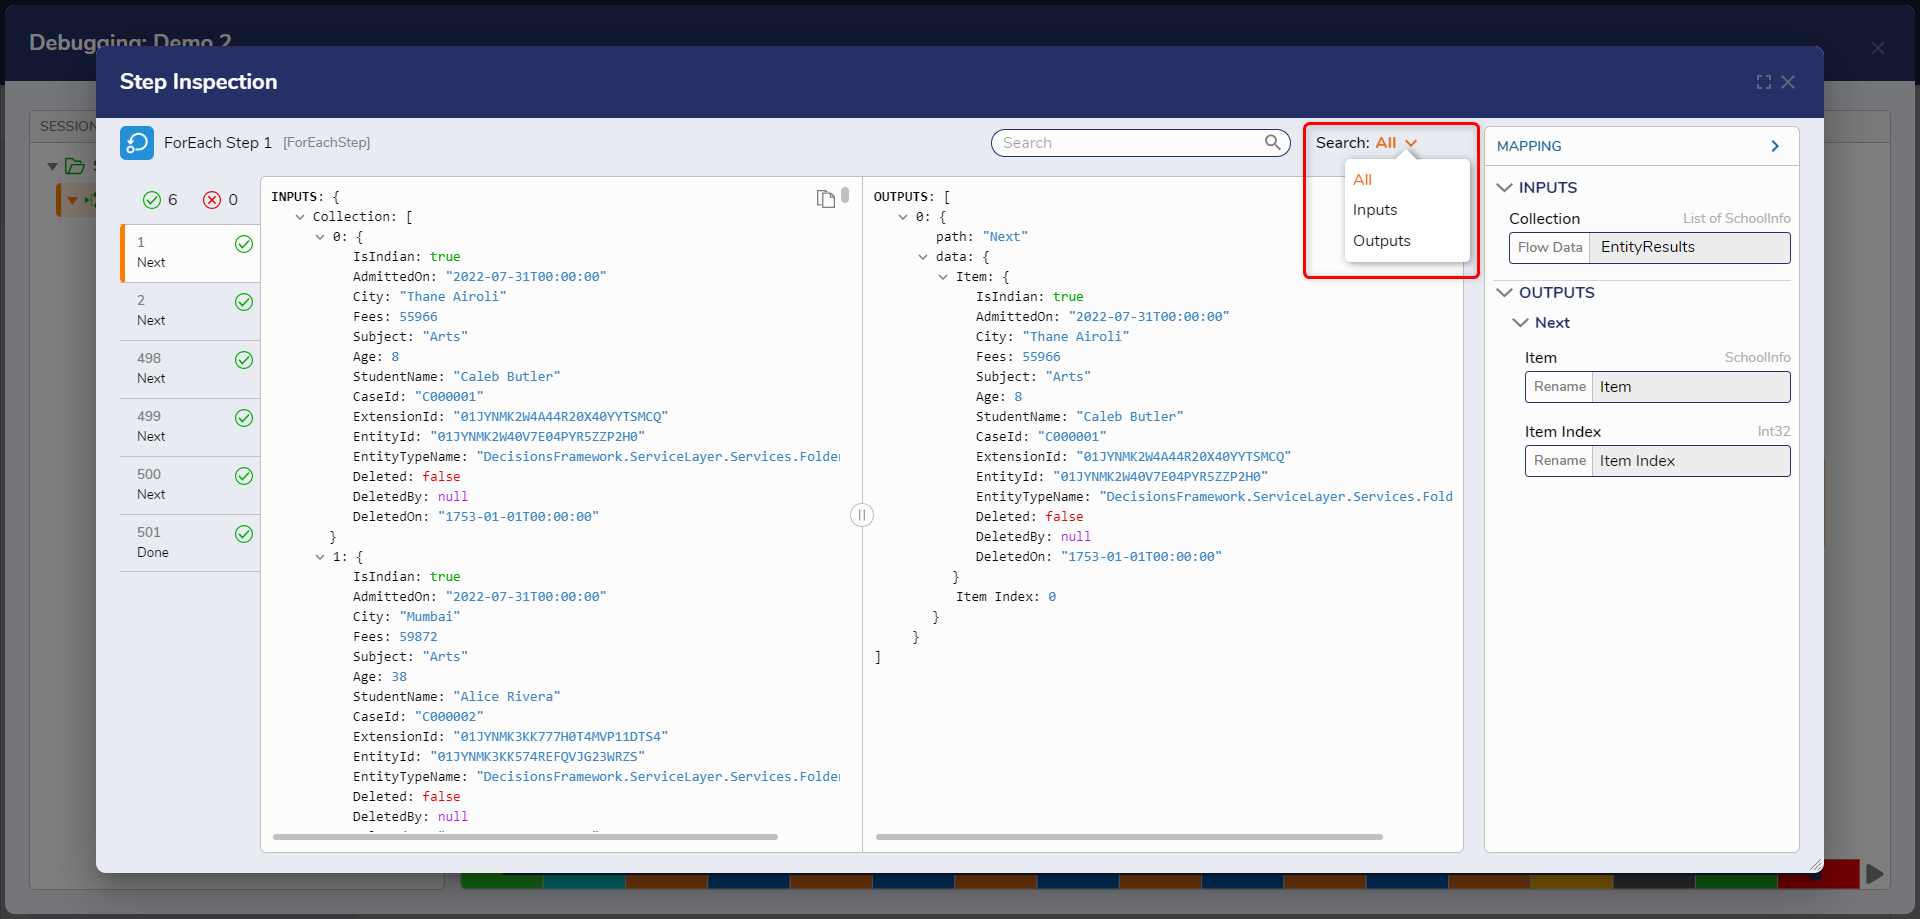
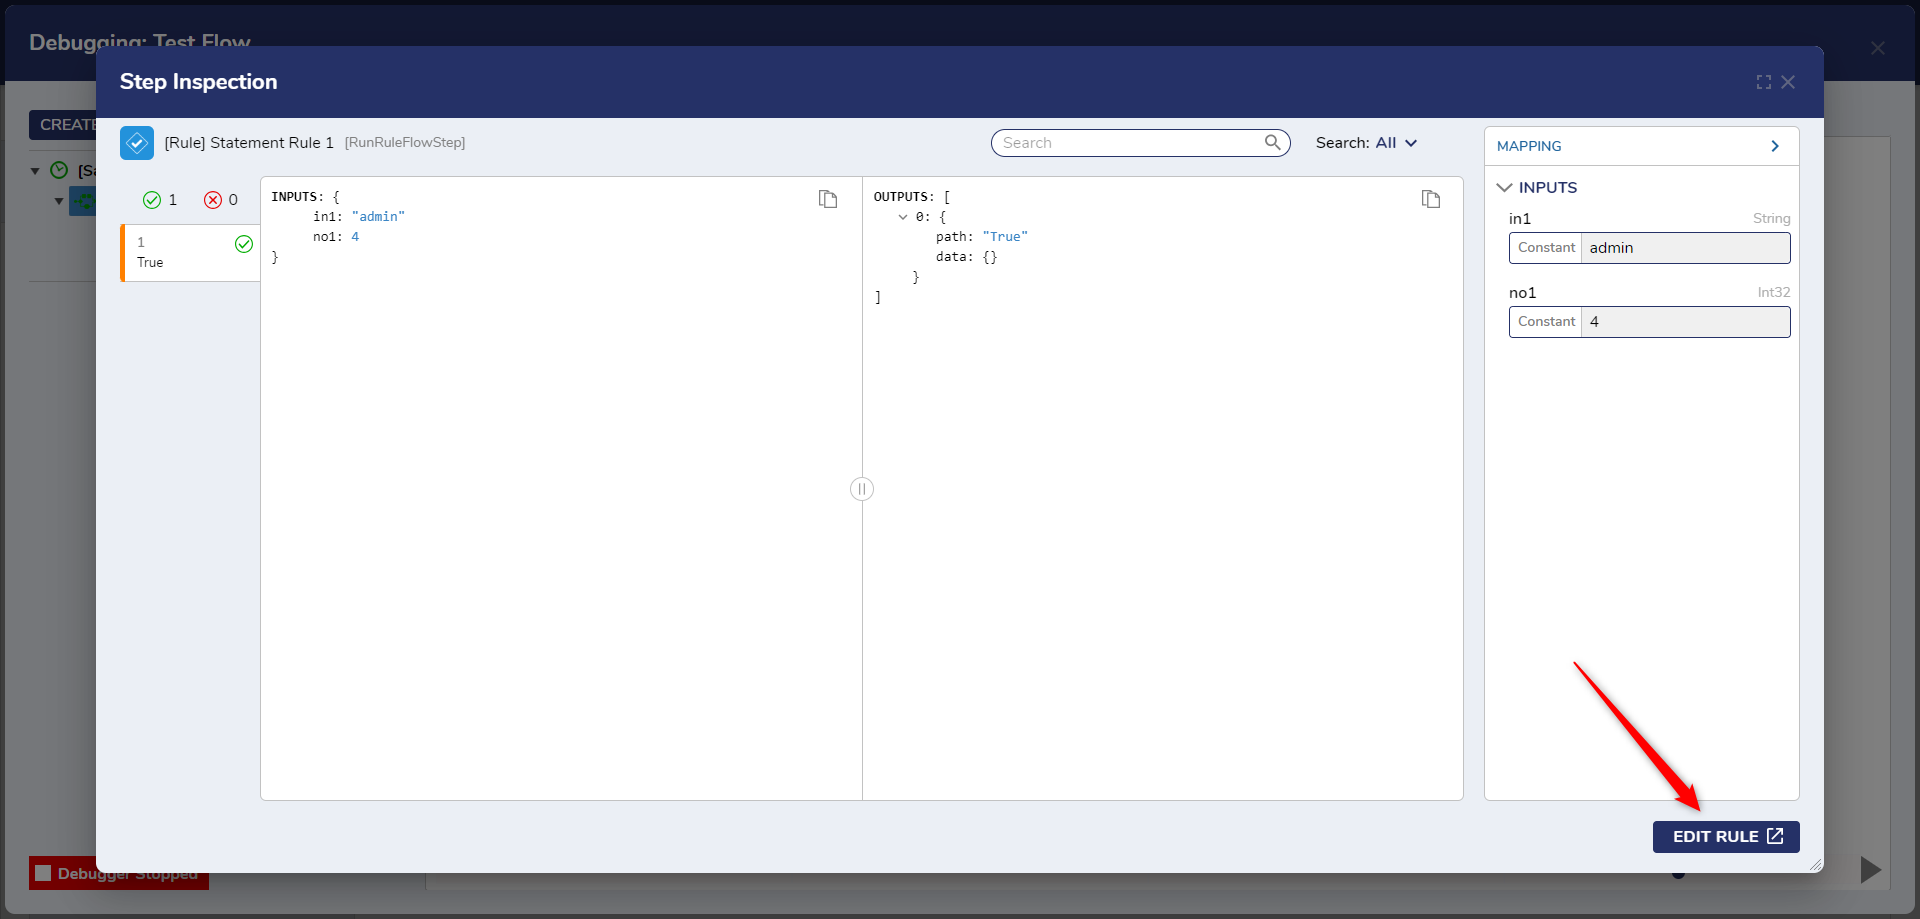
New Step Inspection Dialog (v9.12)
We introduced a new way of inspecting a Step in the Debugger to view its inputs and outputs. After completing the debug session, users must click on the Step to view all its debug details. Refer to the following screenshot:
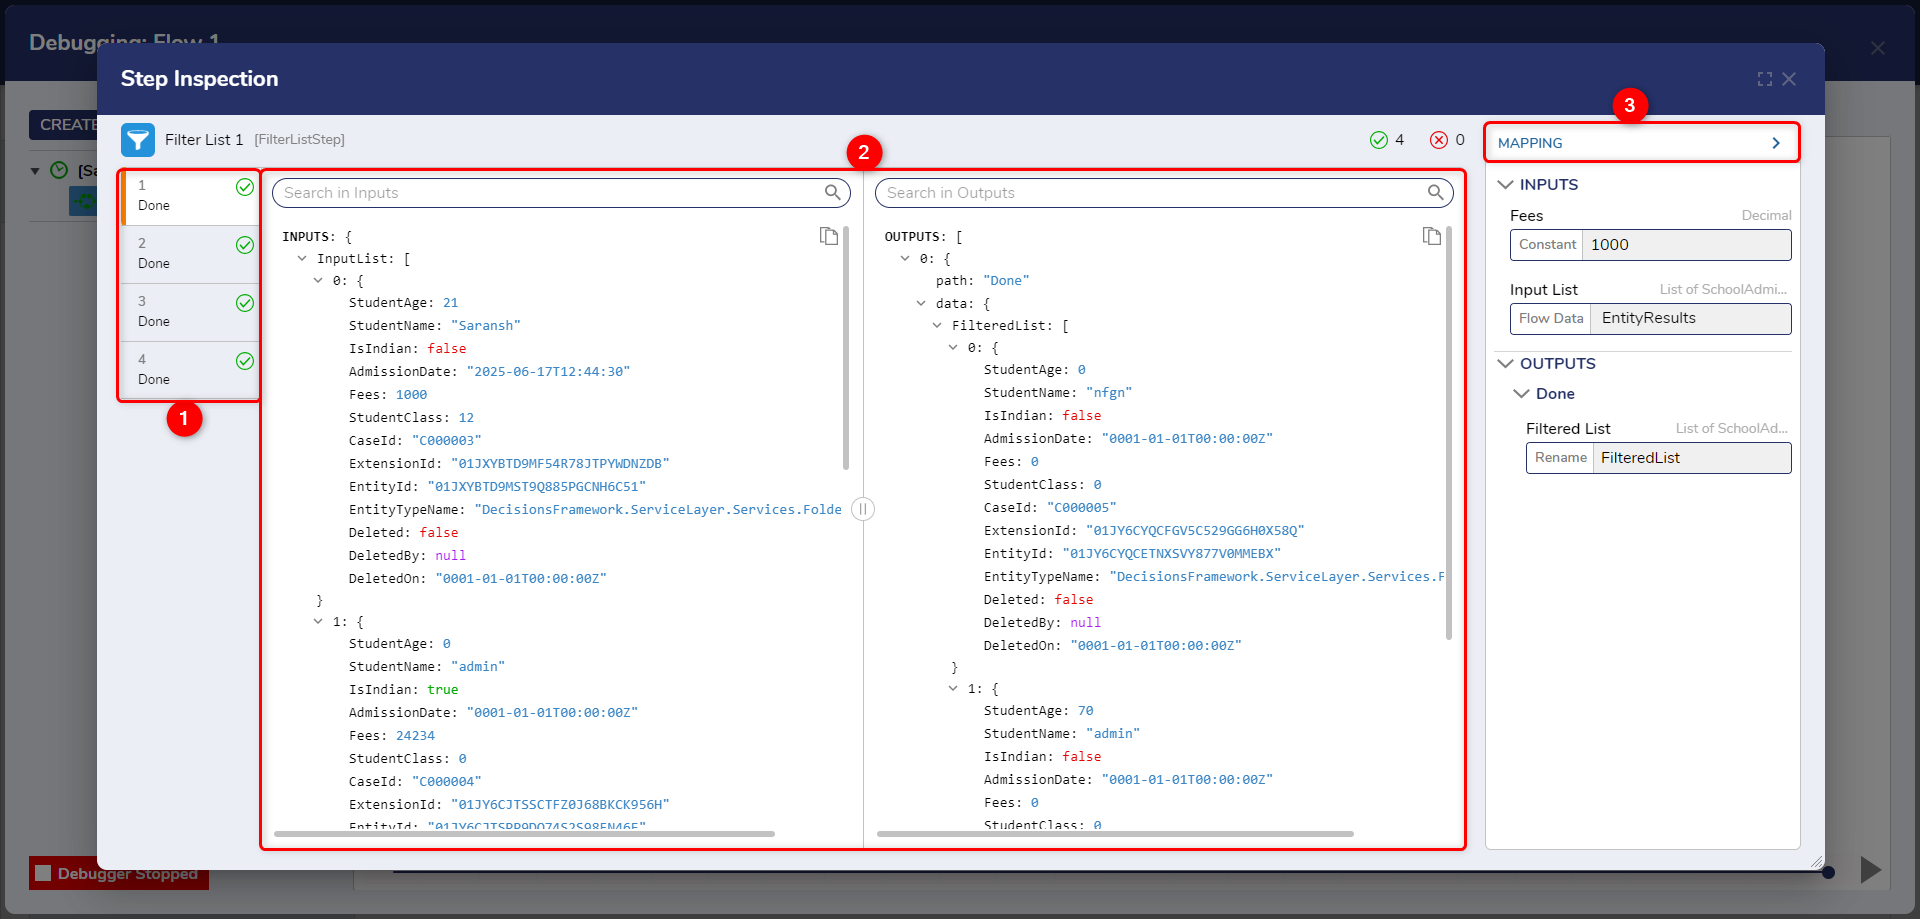
- Step Execution Count: This Panel on the left shows all the step execution iterations. If a Flow uses a ForEach or ForLoop step, which loops the Flow and runs the Step multiple times, this list shows all the iterations that the Step has gone through. Users can click on any iteration to view the data for that specific iteration.
- Input and Output View: This section shows all input and output data associated with the selected Step. Users can copy the data individually using the copy button in the top-right corner. The splitter between panels can be dragged to adjust the view, and a search bar allows users to find specific data within the inputs and outputs quickly.
- Mappings Panel: This panel, similar to the Step Properties panel, is read-only and displays the mapping types and data passed through the Step. It helps users understand how data is mapped and transferred within the Flow. In v9.14, the panel has been enhanced to be resizable, allowing users to drag and increase its size for easier reading of mapping information.
Improved Debugger Performance (v9.12)
We have improved the Flow Debugger to handle large flows more effectively. While debugging flows with 40,000–50,000 objects may still take some time to load, the dialog will process and display the data; users just need to wait briefly.
Previously, large Flows of this size often caused the Debugger to become unusable. With these updates, it is now stable and functional even at scale.
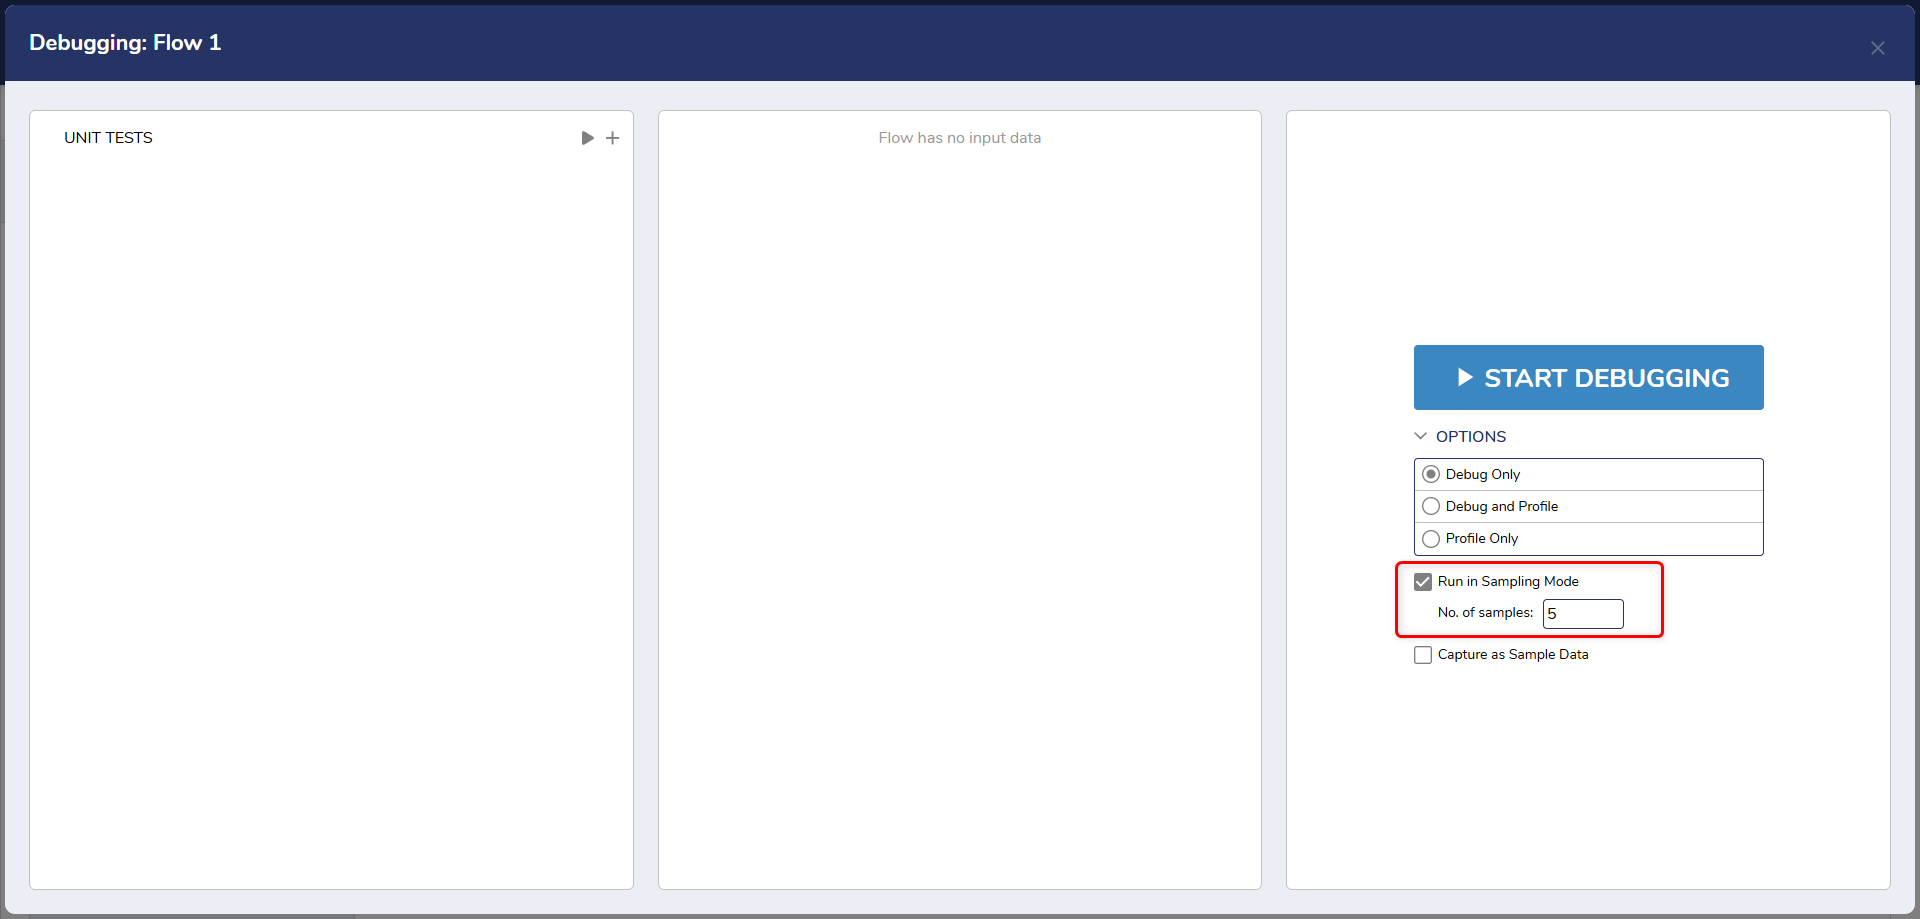
Ability to change the value for Sampling Mode (v9.11)
By default, the Flow Debugger, Unit Tests, and Sample Data are set to run in "Sampling Mode." In Sampling Mode, the Debugger records the data for only five out of all the iterations it is supposed to run. It captures the data of the first two and last three iterations, respectively. This helps reduce memory consumption and makes the Debugger faster.
Users can configure the sampling value and run the Flow in sampling mode for 5 to 100 iterations.