Parent-Child Report Filtering Using a Bar Chart
- 27 Jul 2022
- 1 Minute to read
- Print
- DarkLight
Parent-Child Report Filtering Using a Bar Chart
- Updated on 27 Jul 2022
- 1 Minute to read
- Print
- DarkLight
Article Summary
Share feedback
Thanks for sharing your feedback!
Overview
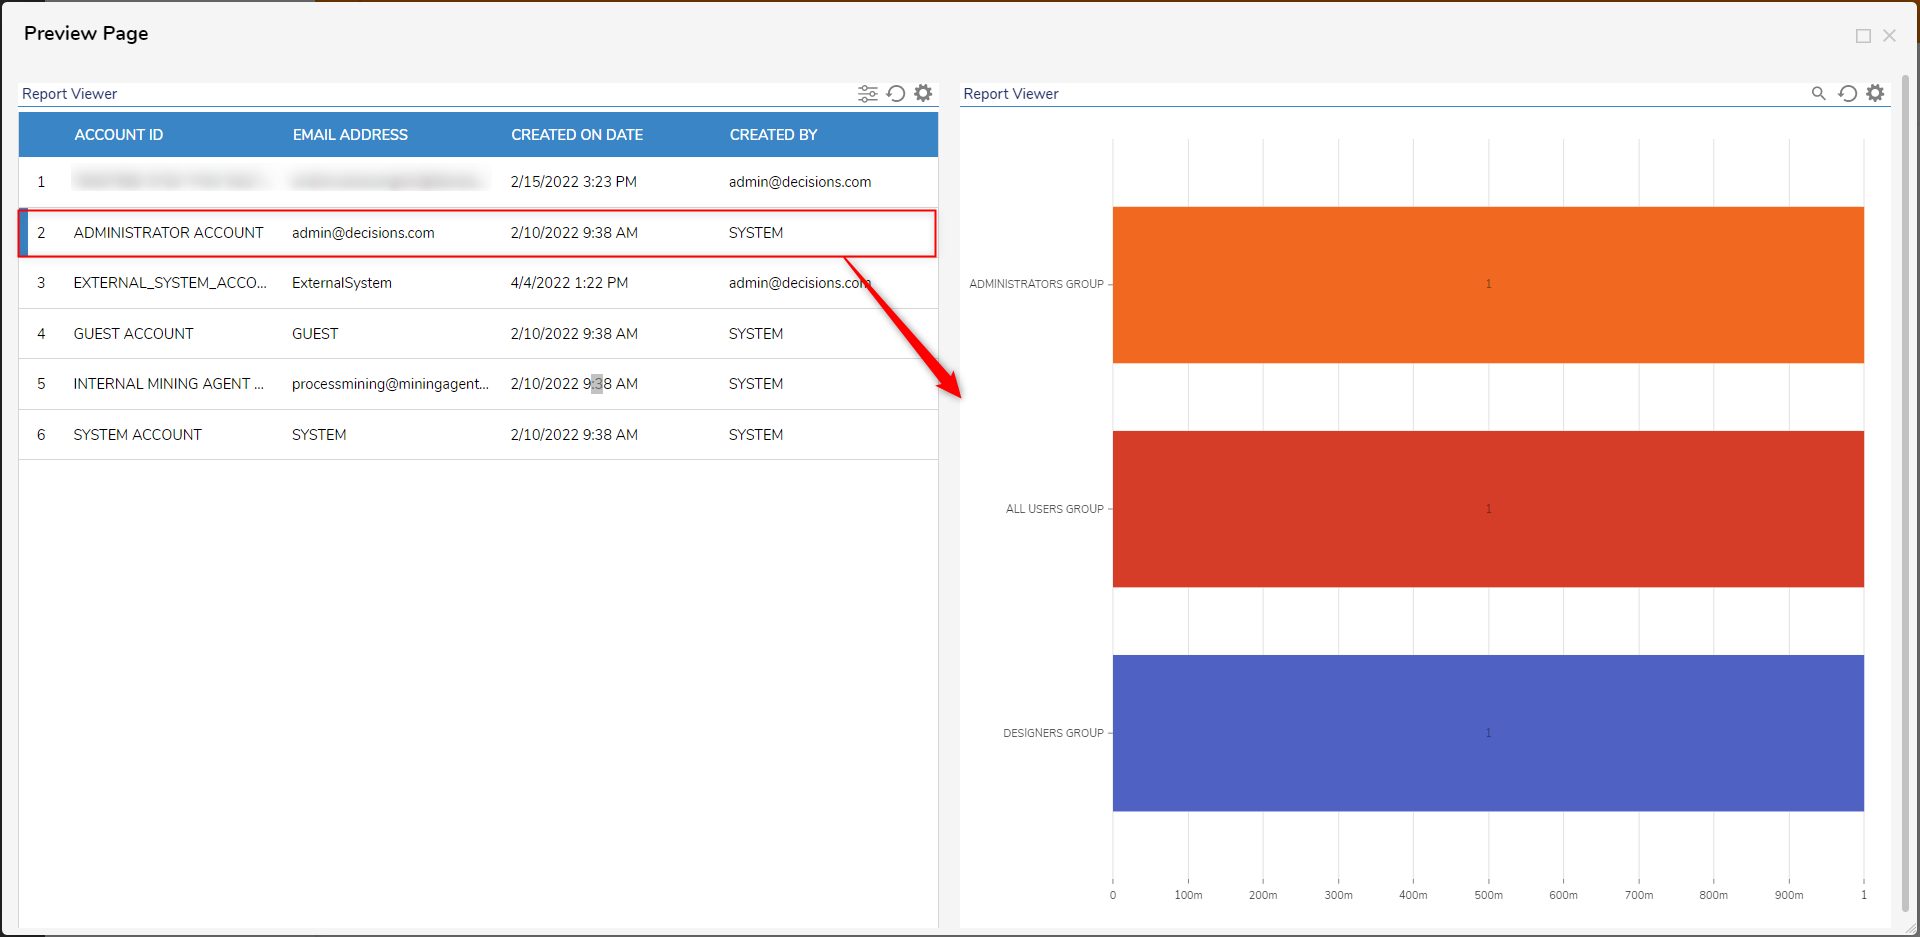
A Page that contains two Reports can be configured to send data based on Row selection in the Parent Report to the Child Report for use as a filter. This allows the ability to view the information in the Child Report specific to a line item selected on the Parent Report.
This functionality can then be combined with the ability to add a Chart View and subsequently used to filter the contents of the Chart. The following document demonstrates how to use a Parent Report to filter the information displayed on its respective Child Report to display information about which Groups a selected Account belongs to.
Example
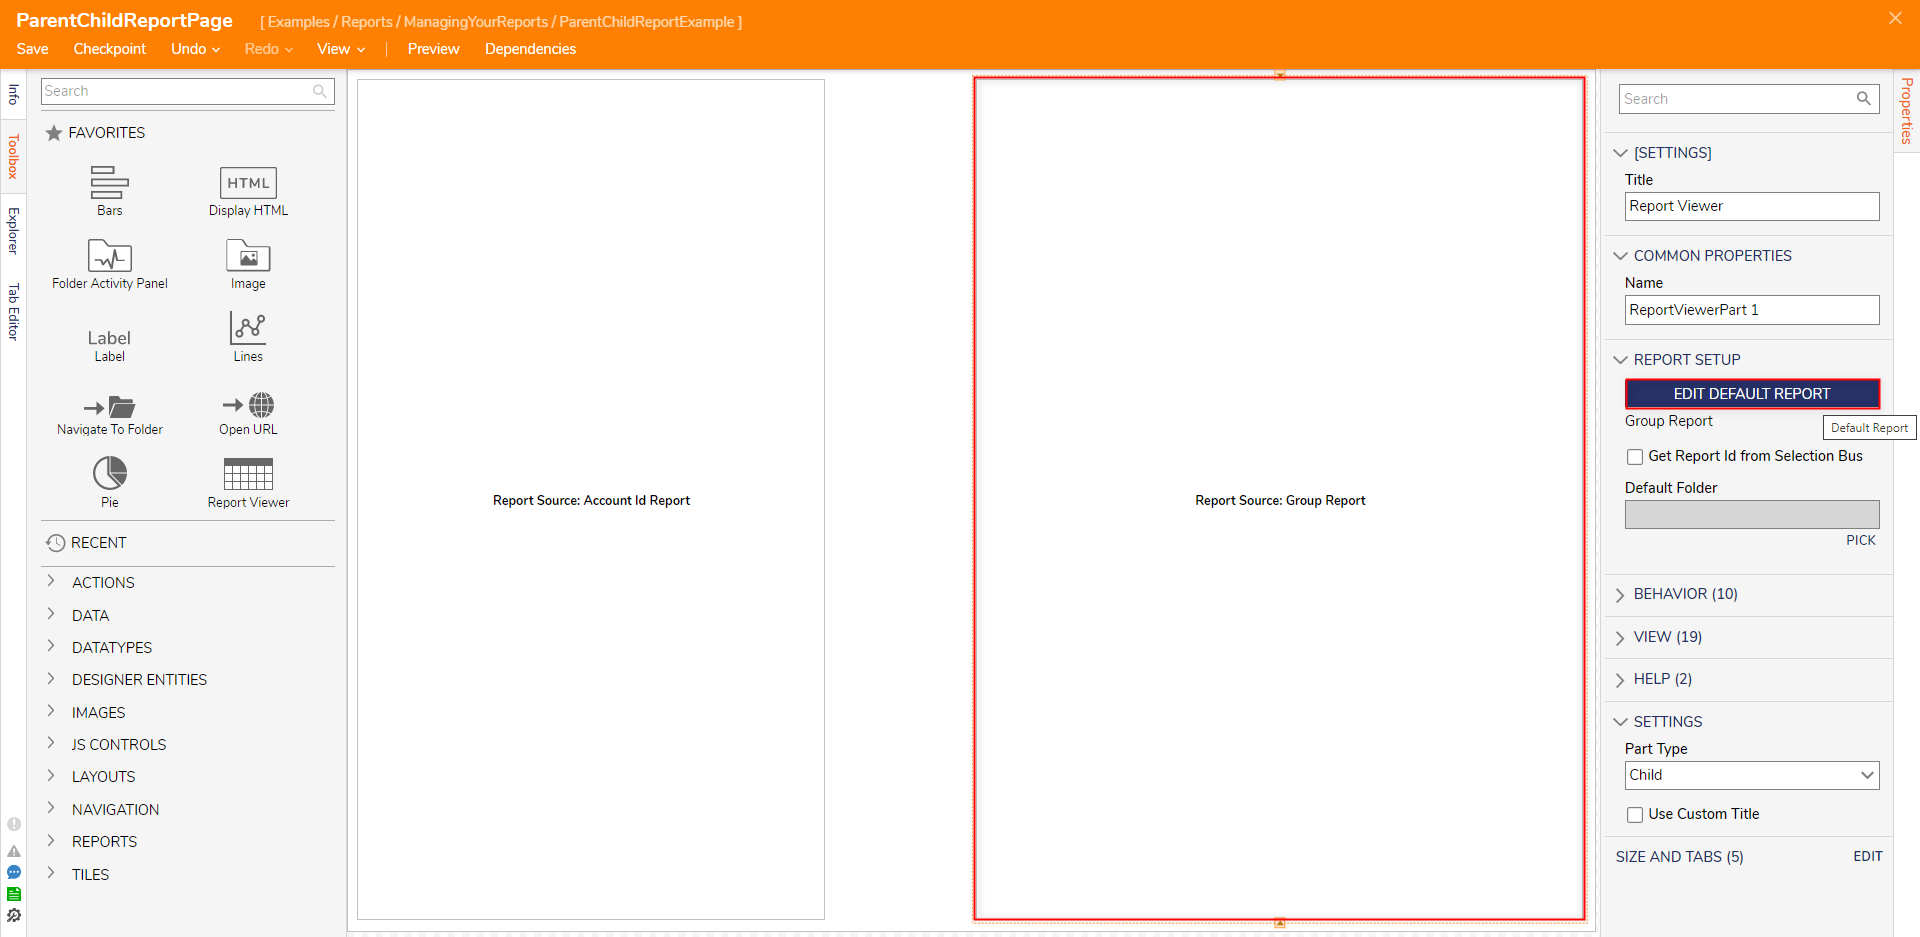
- Open a previously created Parent/Child Report. From the Page Designer, navigate to the Properties of the Report Viewer containing the Child Report, then click EDIT DEFAULT REPORT.
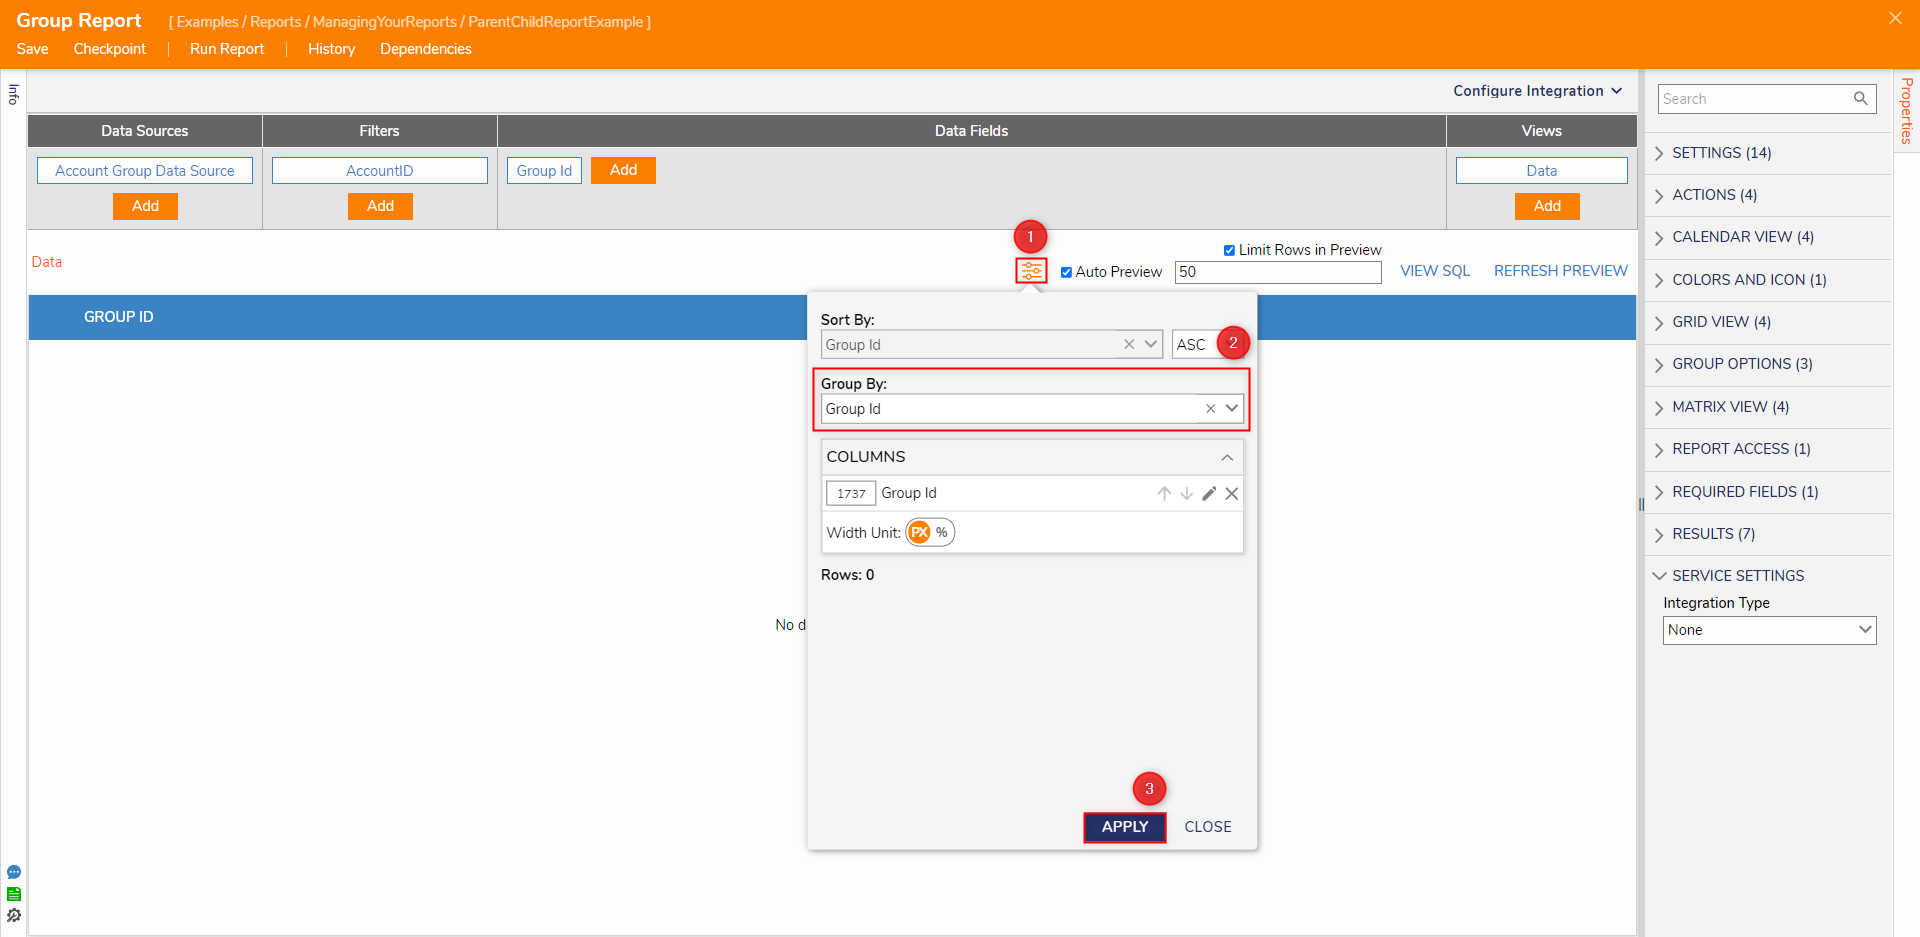
- From the Report Designer, select the Settings icon (abacus); under Group By, select Group Id, then click APPLY.
- Under Views, click Add. Then, under Charts, select Bars. From the Add Bars Chart window, provide the Title "Groups," then click OK.

- Save and Close the Report and Page Designers.
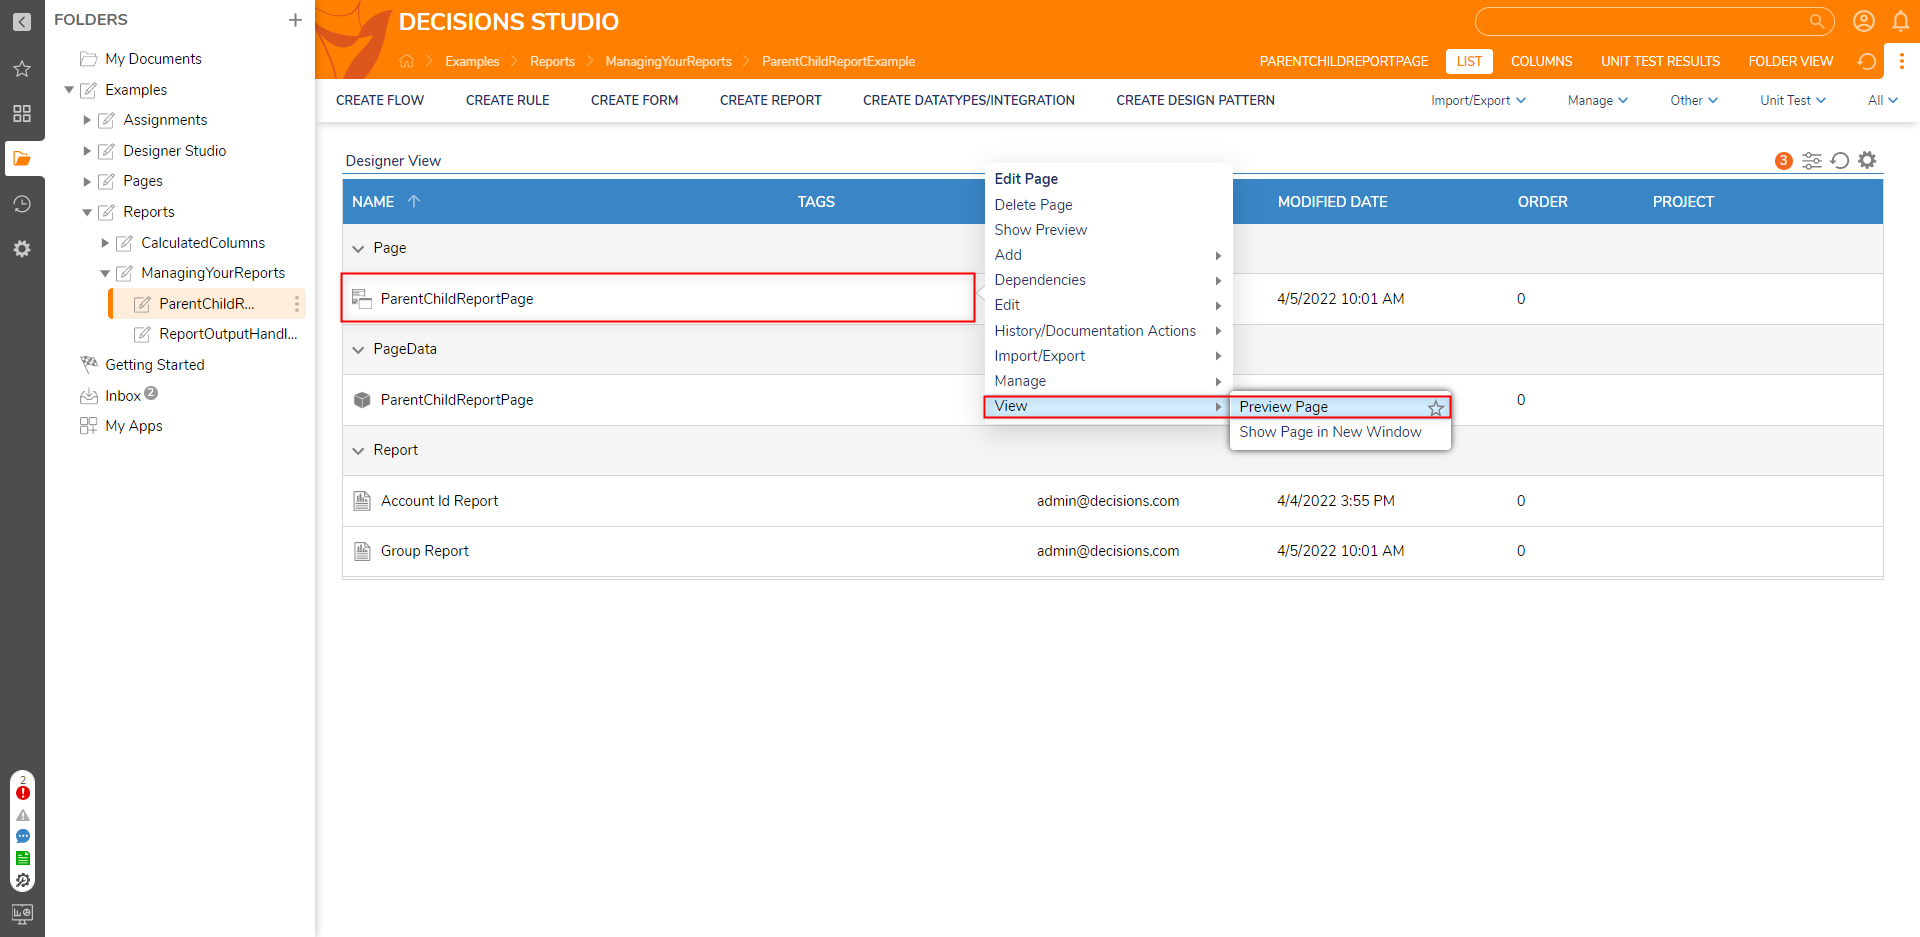
- Back in the Designer Project containing the Page, right-click the Page and select View > Preview Page.
- On the Preview Page, locate the Settings (gear) icon on the Child Report and change the View from Data to Bars.
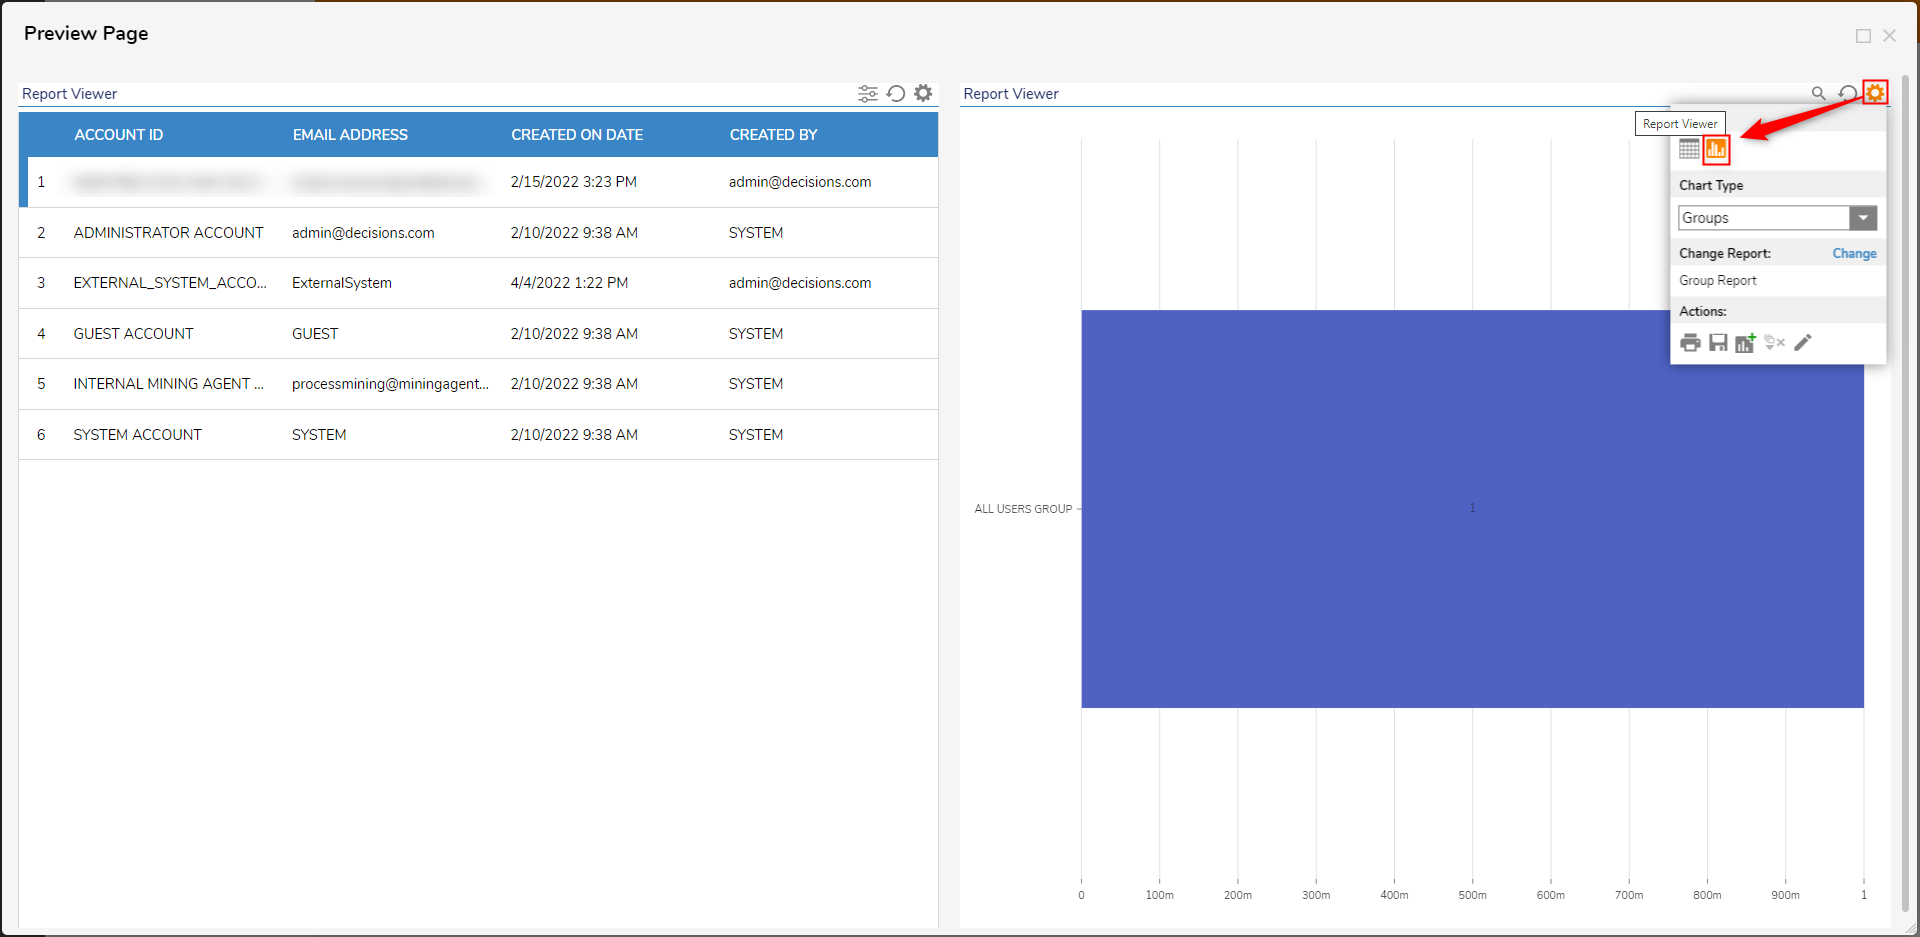
- Click different Accounts listed in the Parent Report and verify that the Child Report's Bar Chart changes to display the corresponding Groups associated with the selected Account.


For further information on Reports, visit the Decisions Forum.
Was this article helpful?