Diagram Tiles
- 28 Jul 2022
- 1 Minute to read
- Print
- DarkLight
Diagram Tiles
- Updated on 28 Jul 2022
- 1 Minute to read
- Print
- DarkLight
Article Summary
Share feedback
Thanks for sharing your feedback!
Overview
Diagram Tiles are components on a Page/Dashboard that are used to present data with infographics. These Tiles have a unique Designer Studio that resembles a Flow Designer but uses visual Charts, Shapes, Labels, Images, and more to create the content displayed on the Tile.
Diagram Tiles require both a Diagram Tile Flow as well as an Input Flow to supply the Tile Flow with source data. The following document demonstrates how to create a Diagram Tile that displays an ID Badge as well as a Label of the number of Accounts within a Decisions environment.
Example
- Create a new Page from a Designer Project.
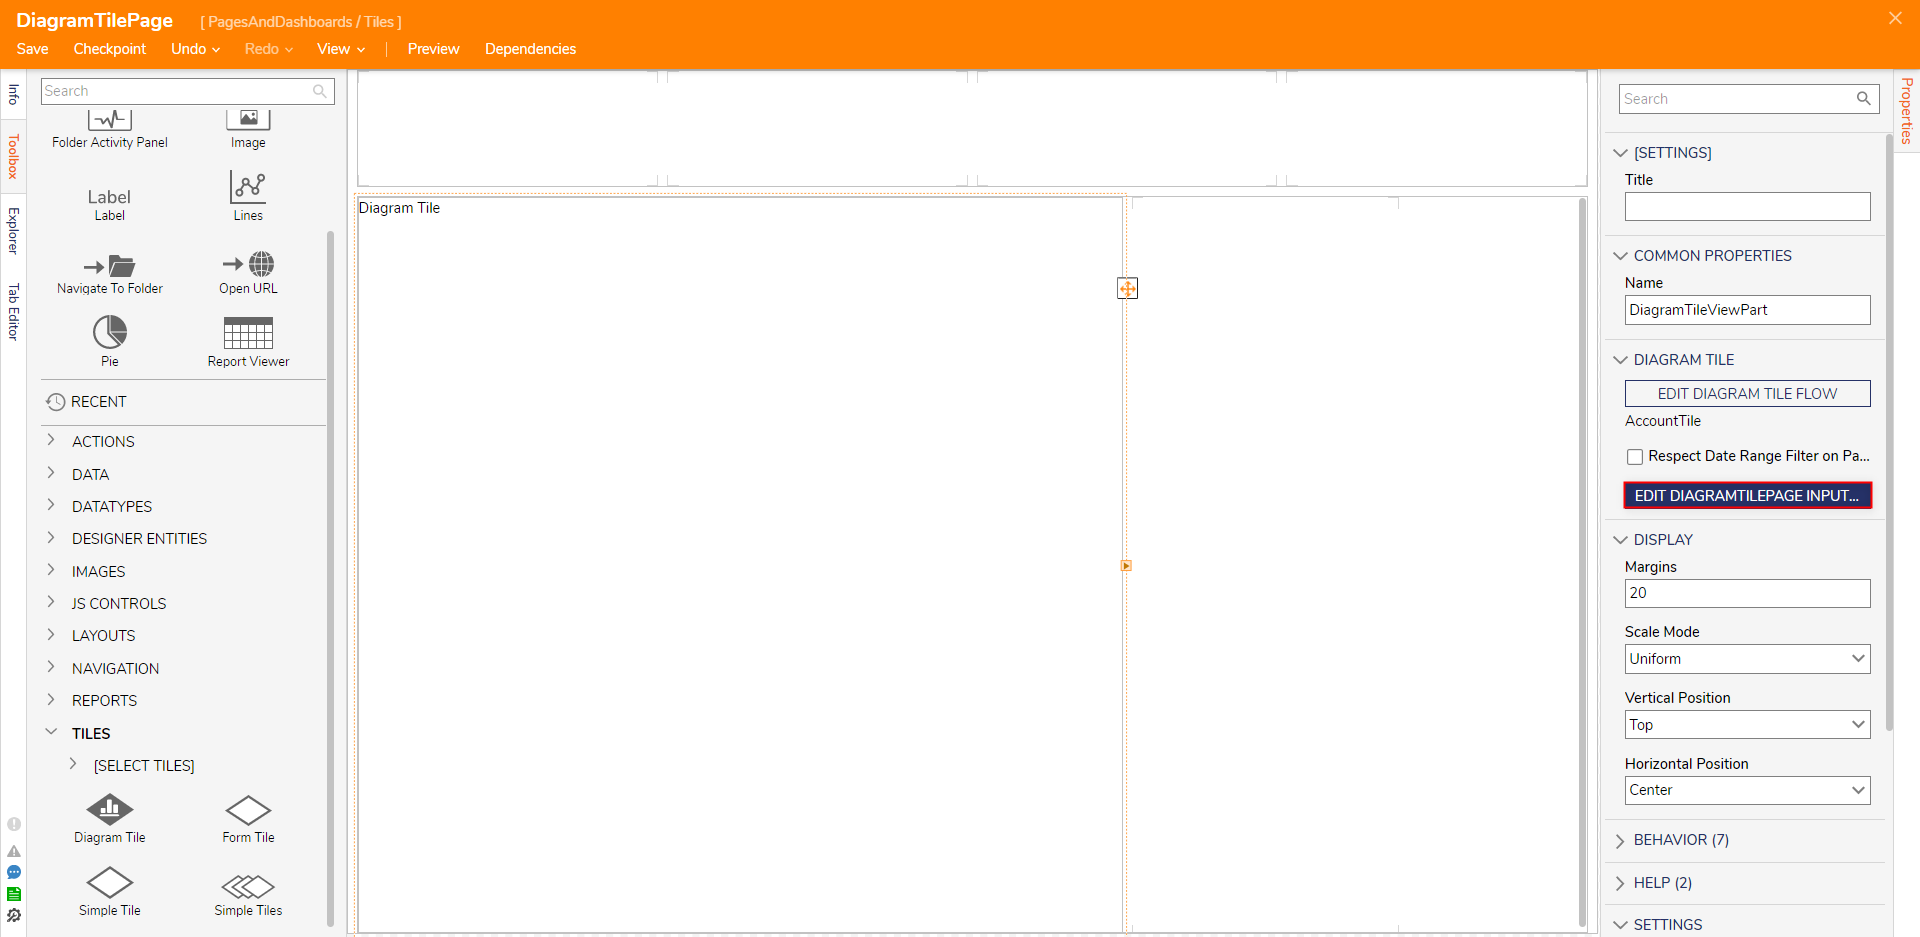
- From the Page Designer, under Toolbox > TILES, add a Diagram Tile to the workspace.
From the Properties tab of the Diagram Tile, select PICK OR CREATE DIAGRAM TILE FLOW. Then, CREATE a new Diagram Tile.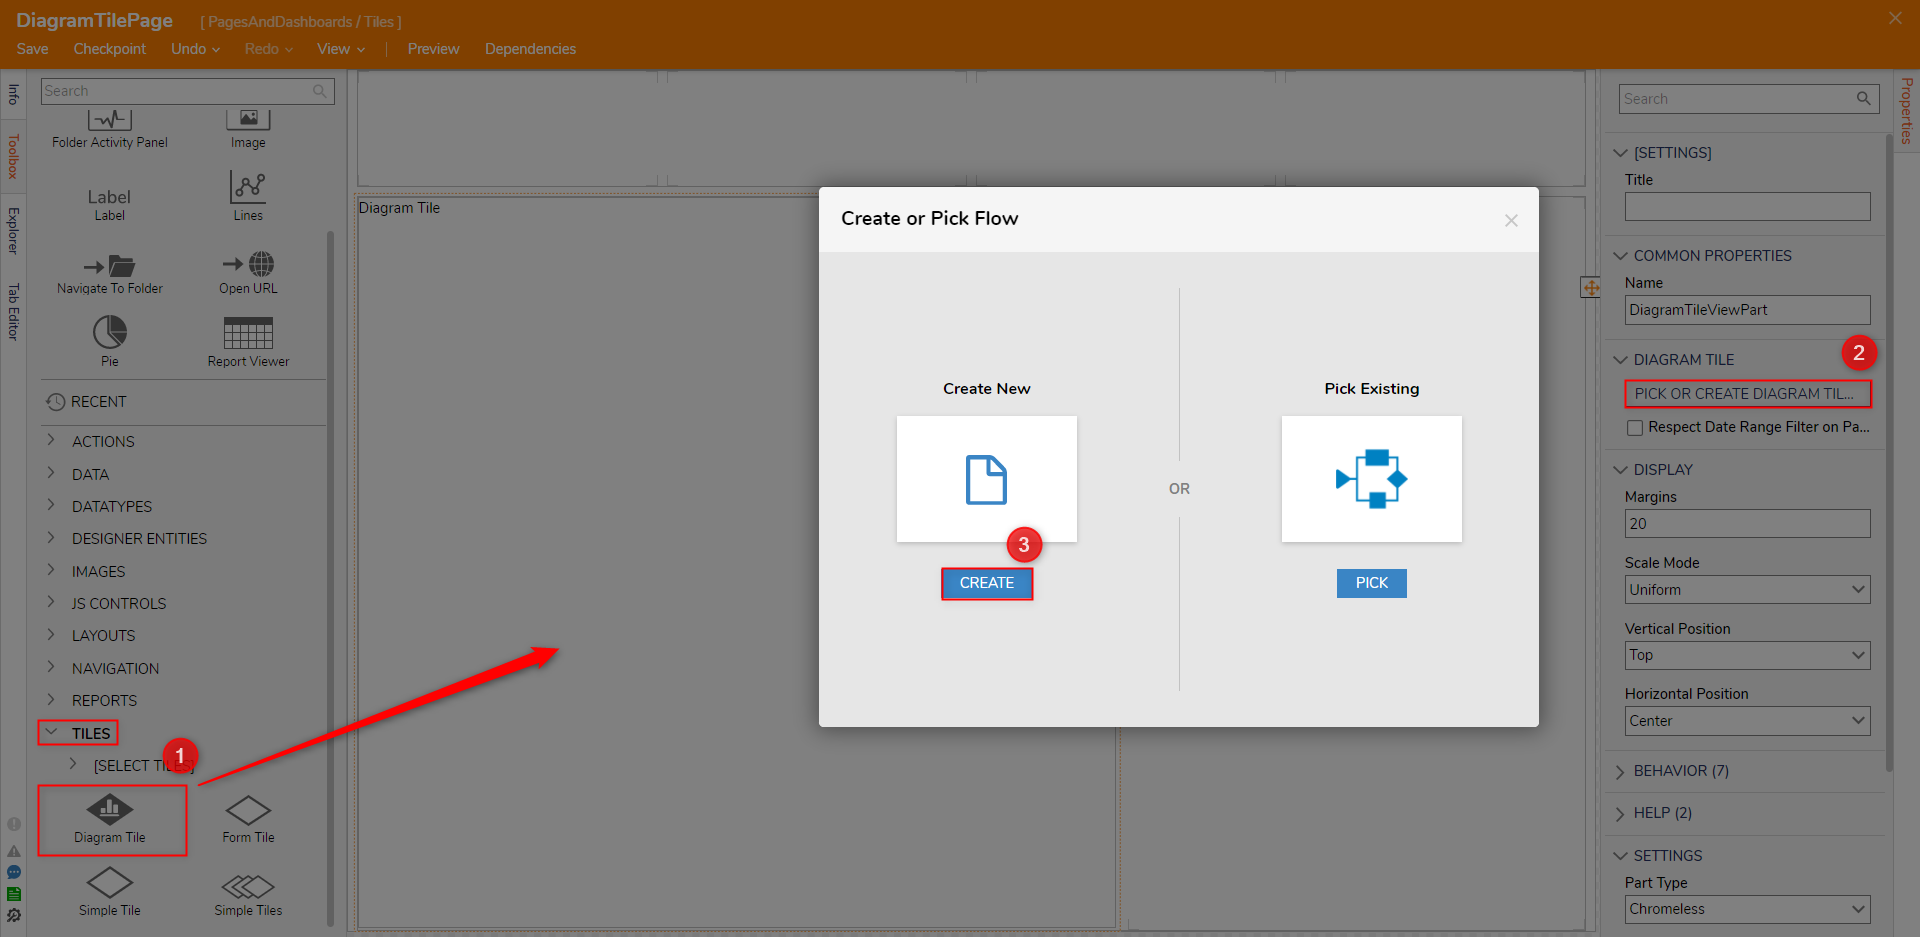
- From the Diagram Tile Designer, under the top Action Bar, click SETUP INPUT DATA. From the Input Data window, provide a NAME for the data.
Then, select Int32 from the TYPE dropdown, and Save and close the window.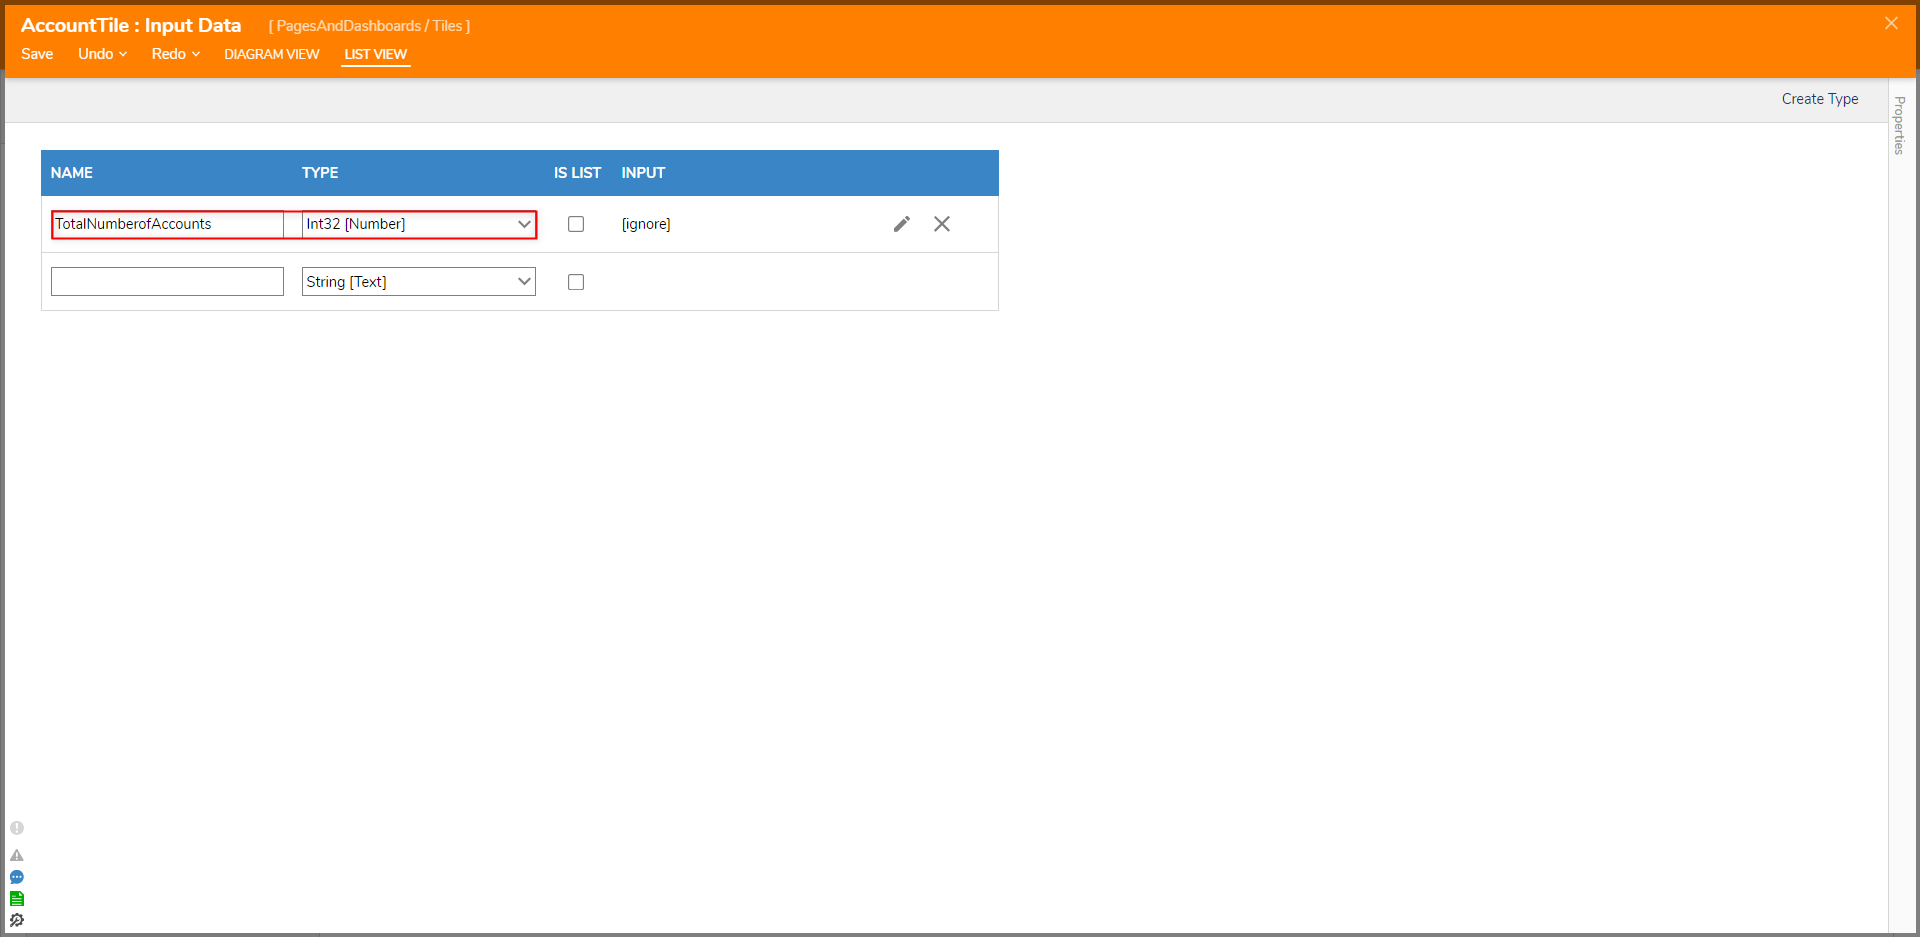
- Under Toolbox > ANNOTATION, drag an Image component into the workspace. If desired, under CONFIGURATION DEFAULTS, adjust the Background Color, Border Width, Z-Order, and/or provide a Label.
Then, under IMAGE, select the Edit button and the Pick Image window to select the desired Image.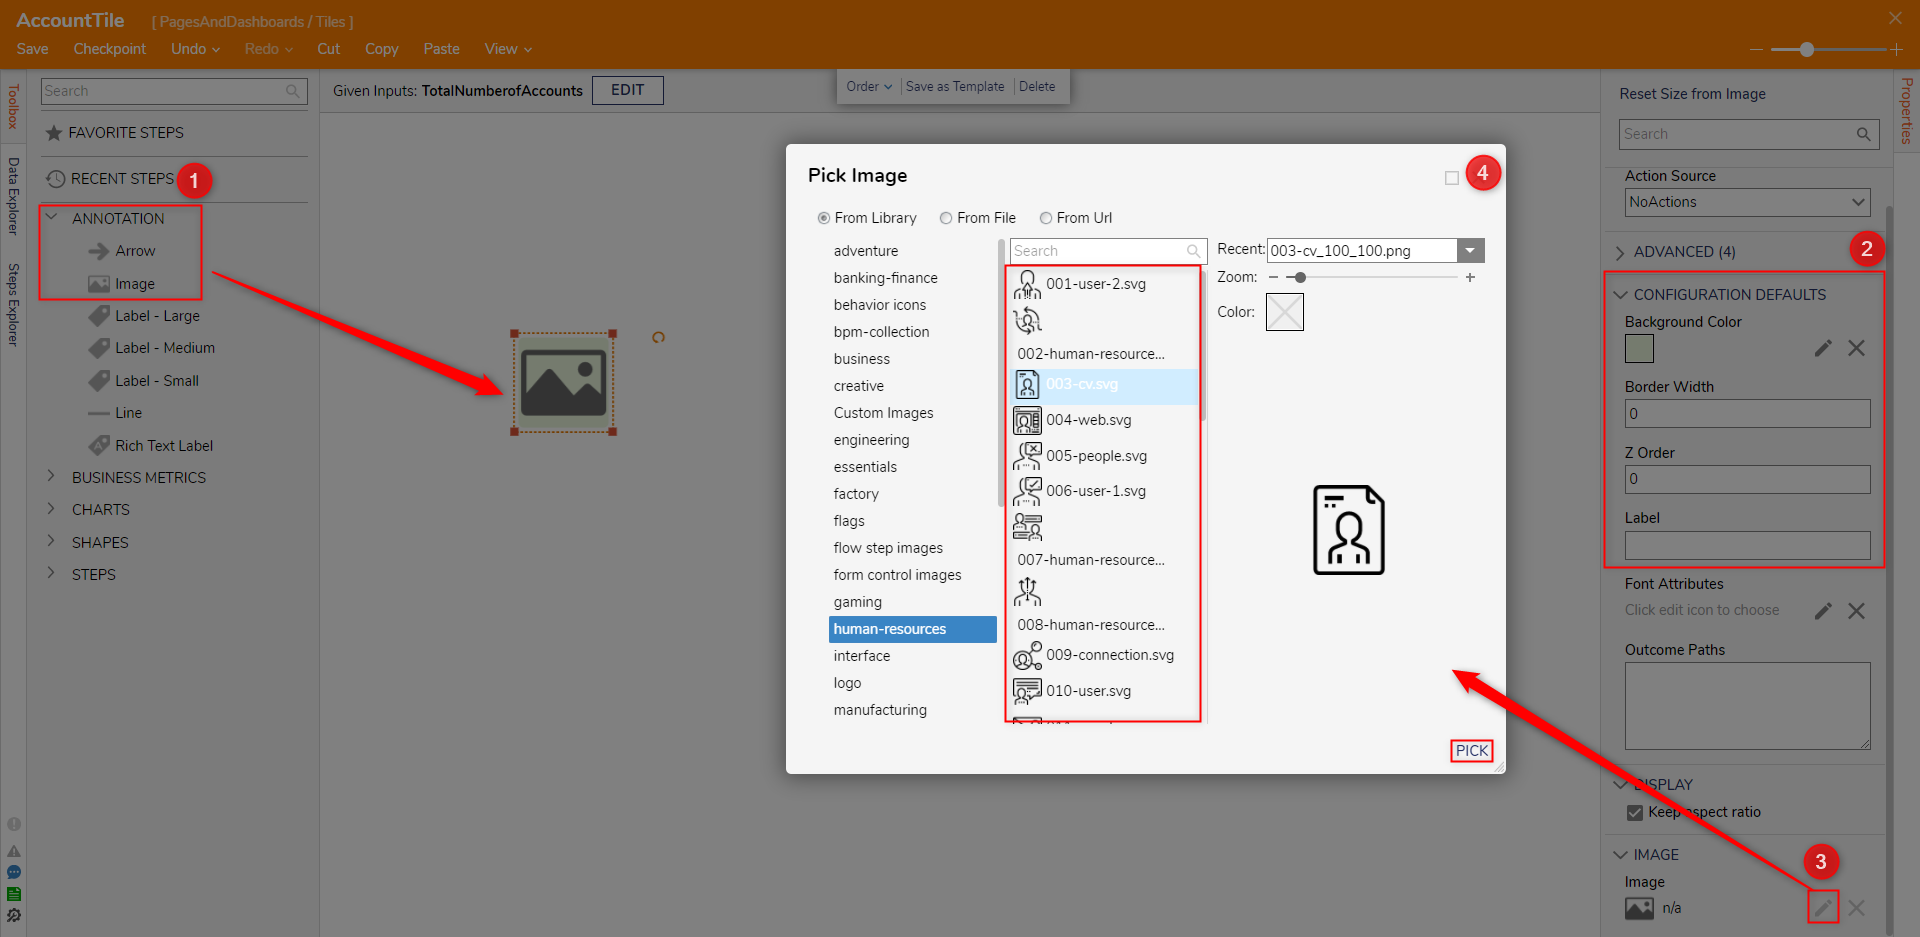
- While still in the ANNOTATION category, add a Label - Medium to the workspace.
From the Properties tab of the Label, under CONFIGURATION RULES, enable Label From Data.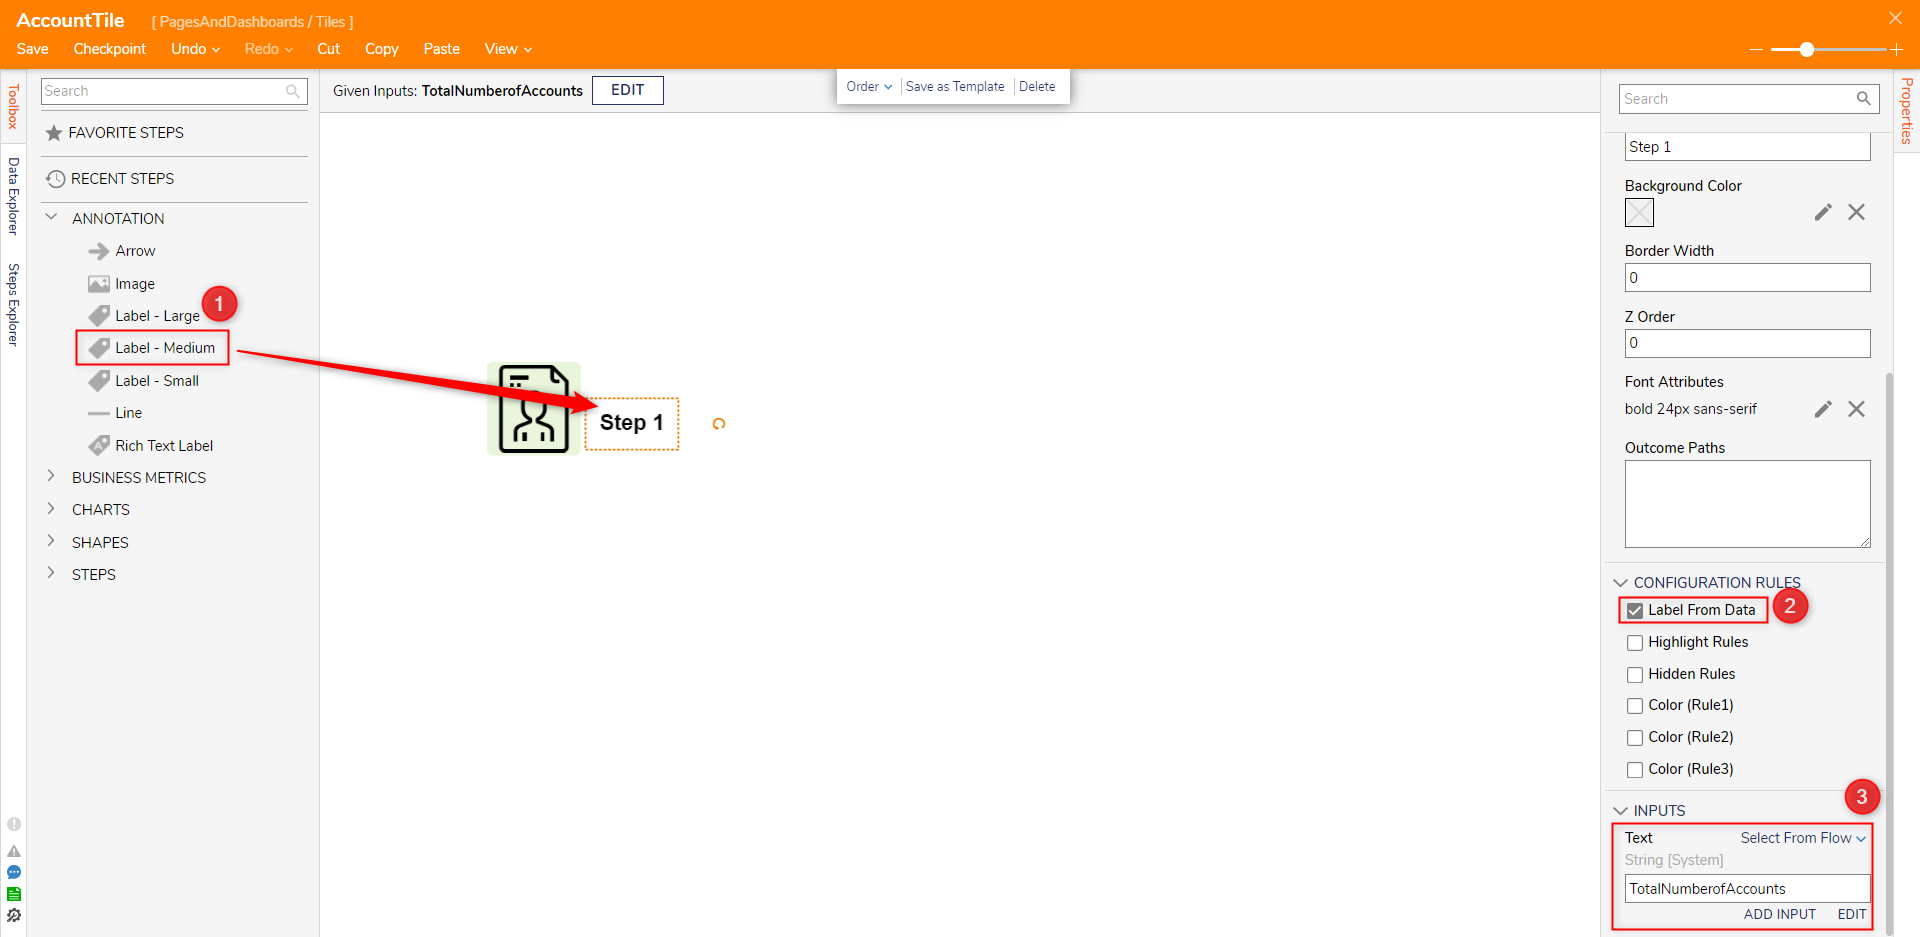
- Save the Diagram Tile Flow, then close via X.
- Back in the Page Designer, under the Properties for the Diagram Tile, select EDIT [PAGE NAME] INPUT FLOW.
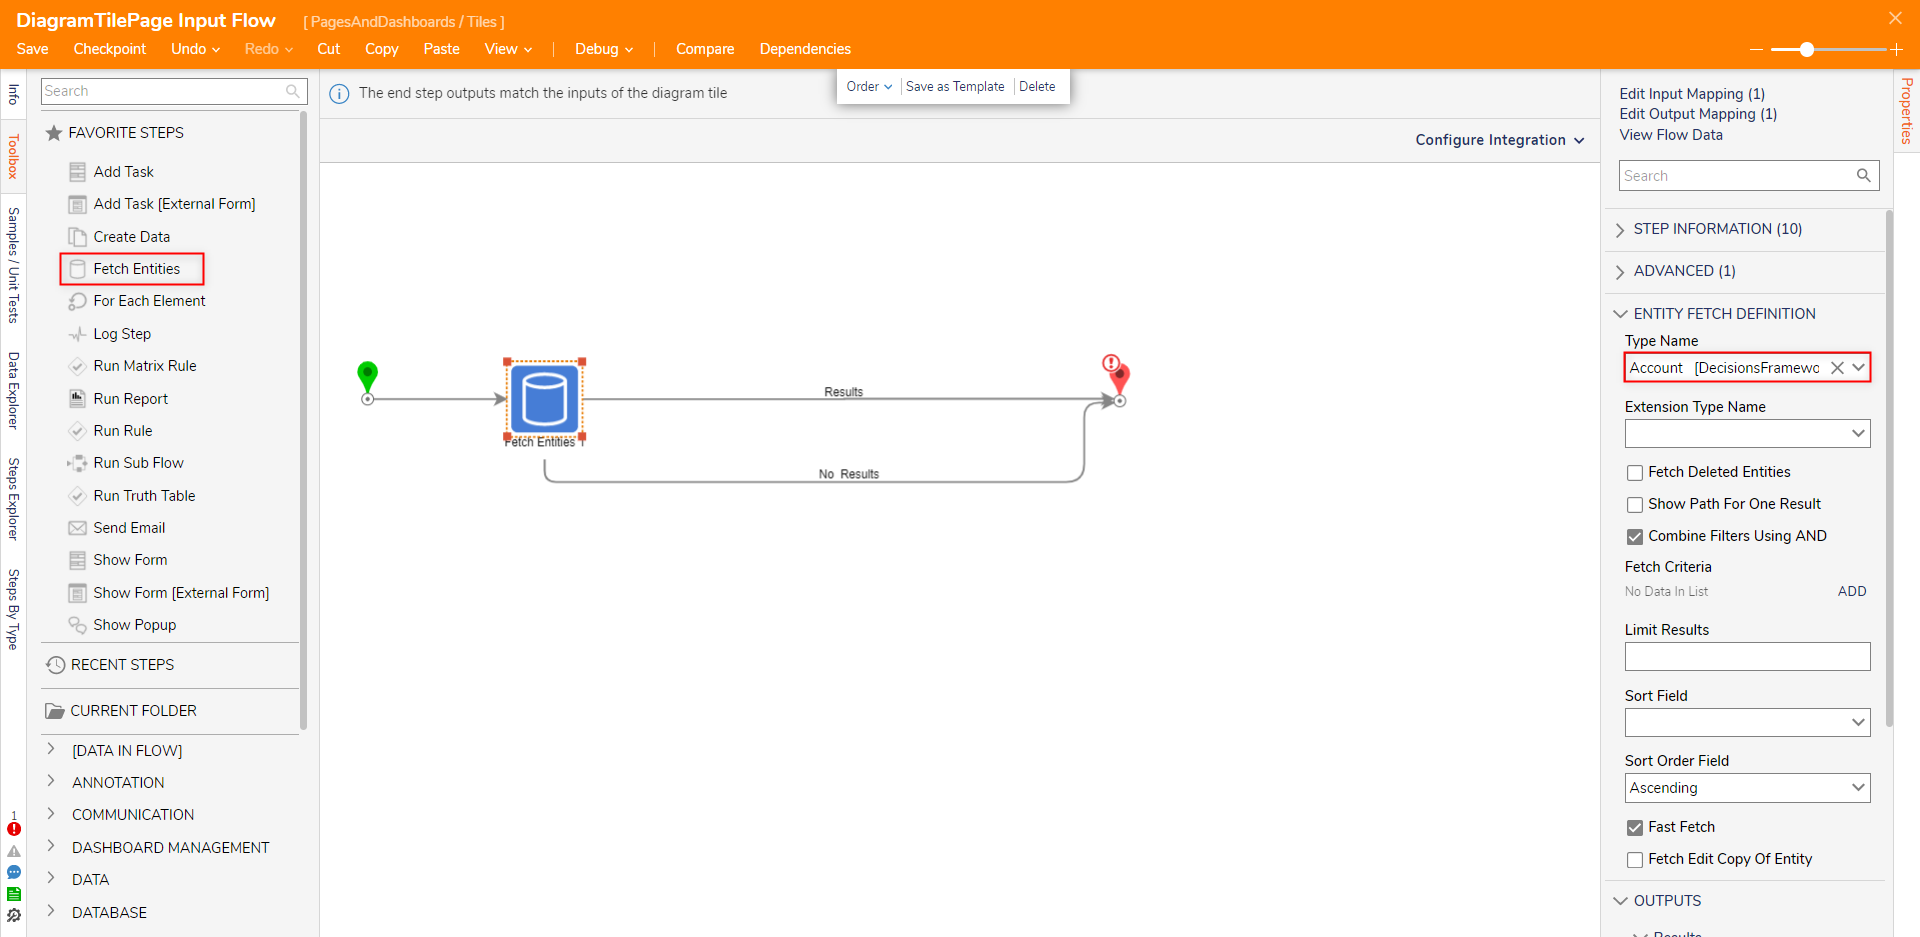
- From the Flow Designer for the Input Flow, attach a Fetch Entities step from FAVORITE STEPS to the Start step. Then connect both Outcome Paths to the End step.
- From the Properties tab of the Fetch Entities step, under ENTITY FETCH DEFINITION, search for and select Account from the Type Name dropdown.
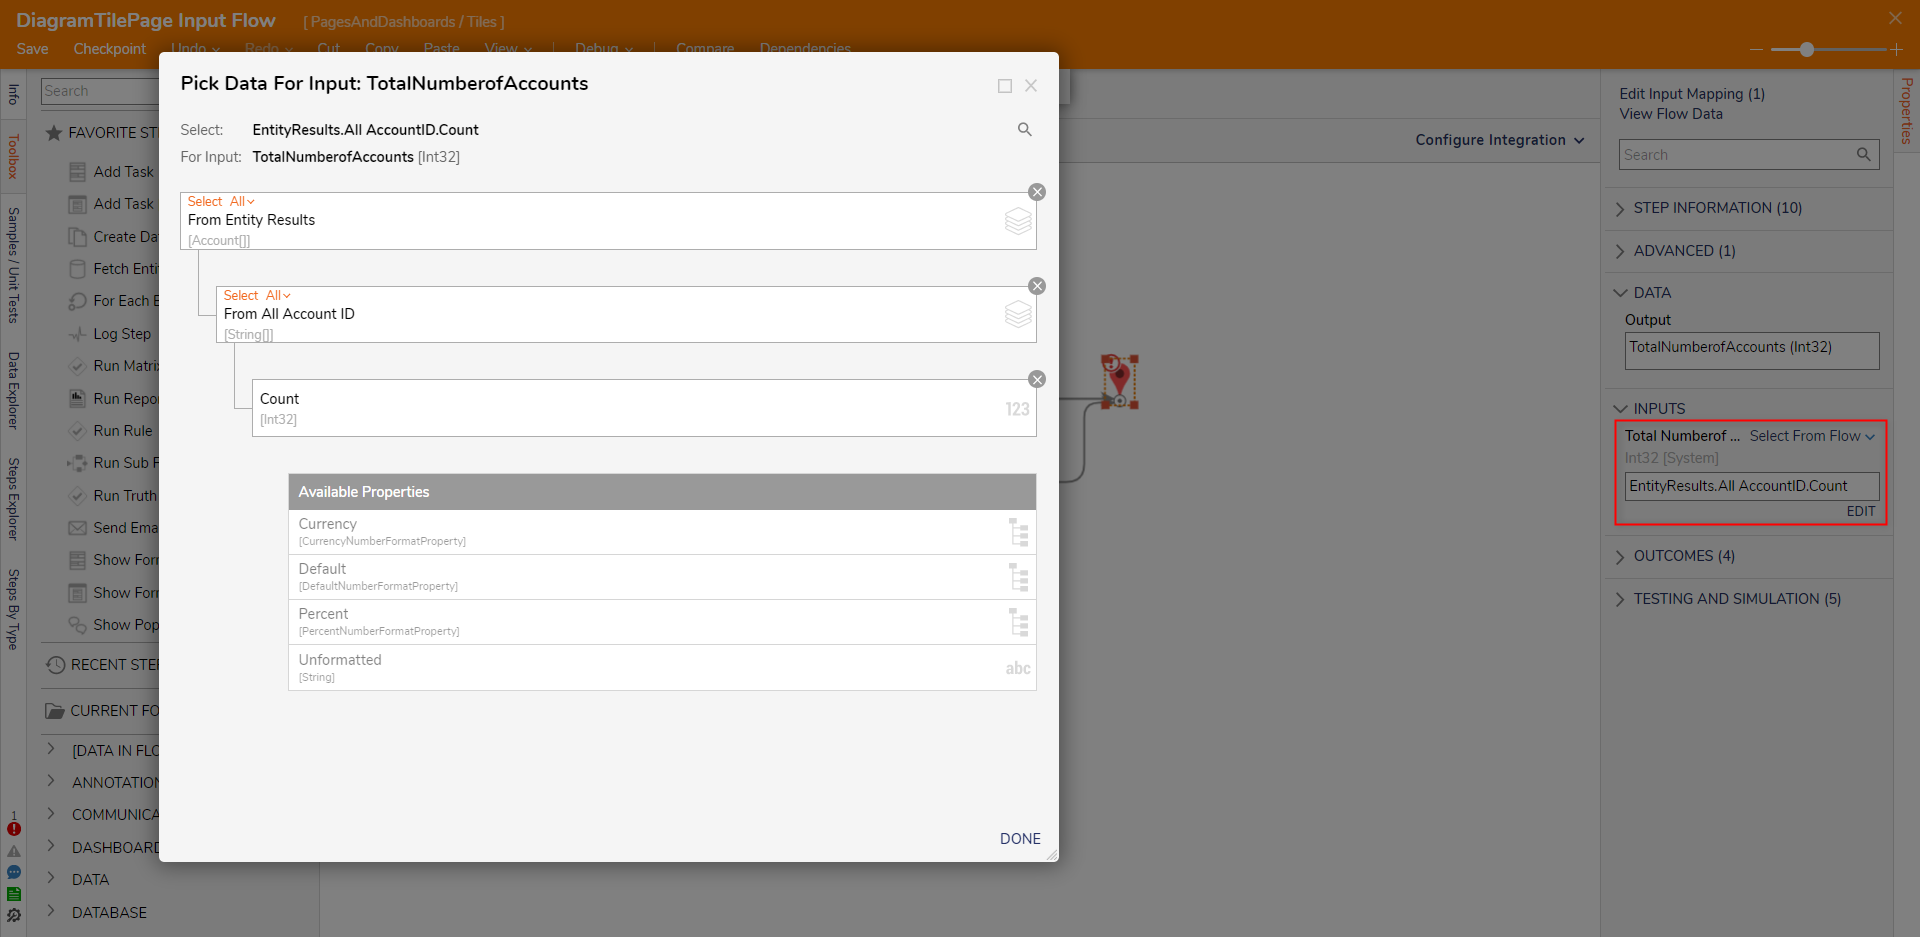
- From the Properties of the End step, map EntityResults.All AccountID.Count to the Input Data.End Step Input DataMapping the Output Entity Results.All AccountID.Count to the Input Data of the End step will allow the Tile to display a count of the retrieved Account ID's in the environment.
- Save and close the Flow Designer.
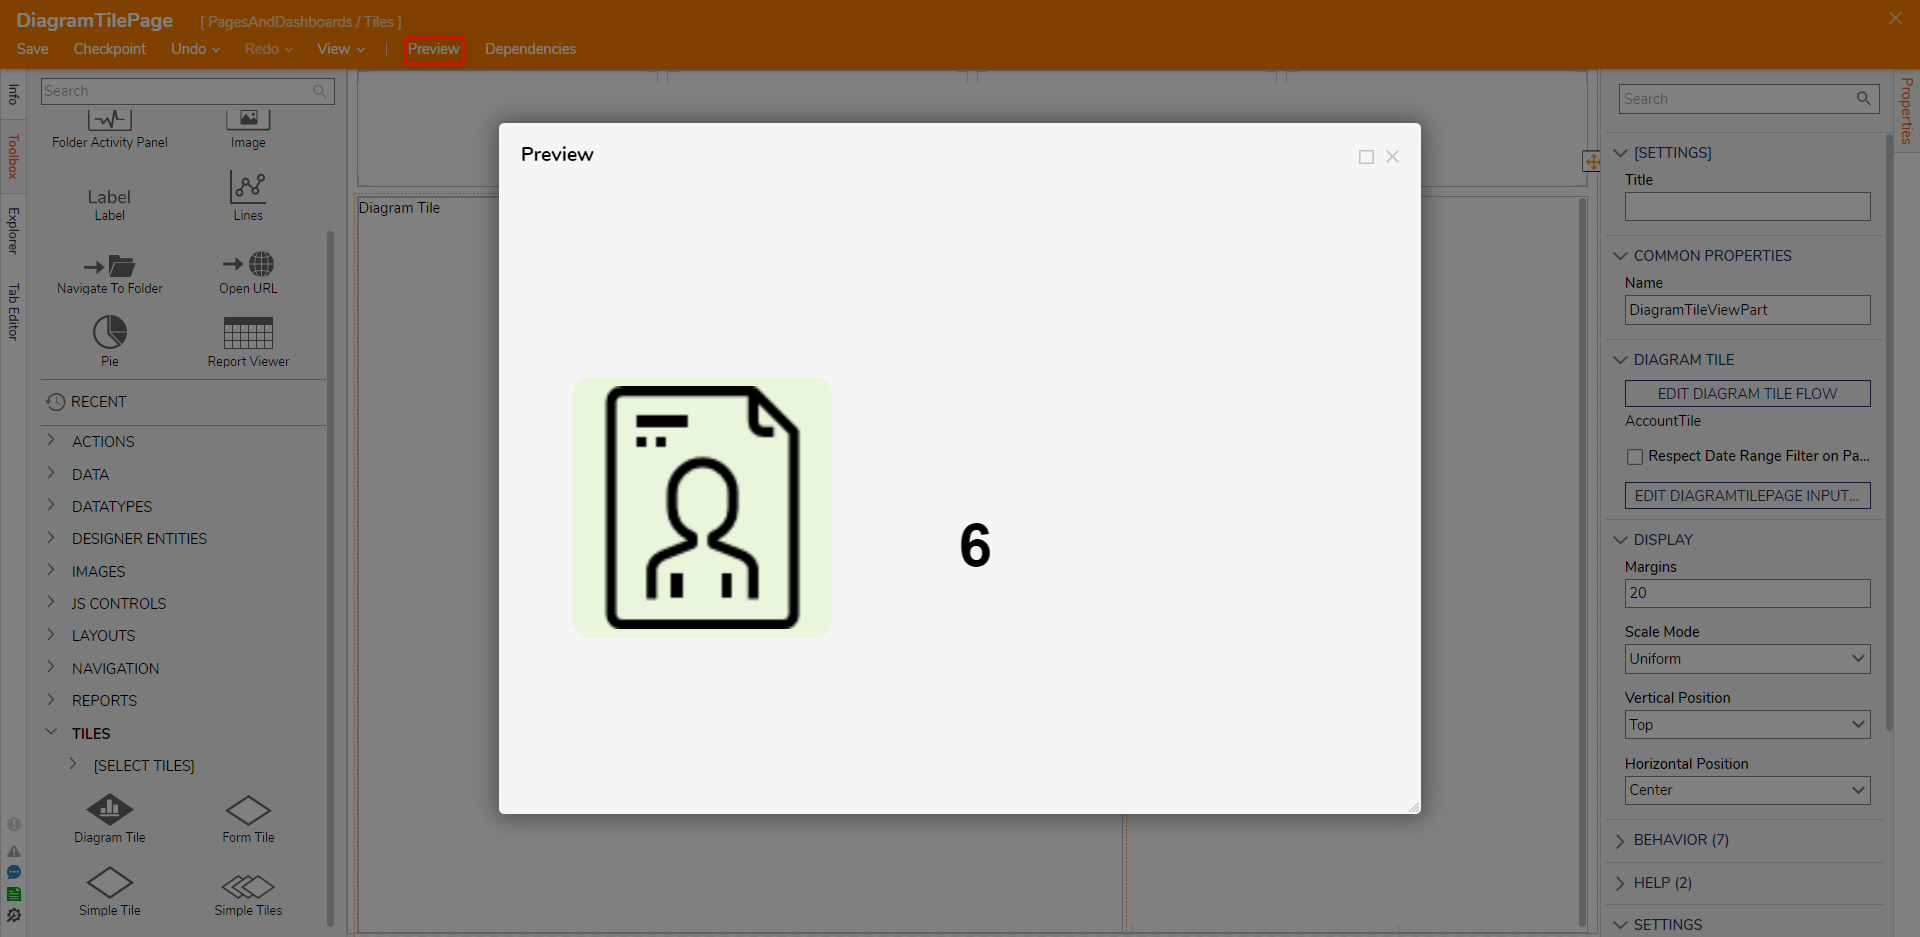
- Back in the Page Designer, select the Preview button on the top Action Bar; verify that the Diagram is displaying the Image and Label text as configured.


For further information on Pages, visit the Decisions Forum.
Was this article helpful?