Best Practices for Performance Troubleshooting
- 14 Mar 2024
- 5 Minutes to read
- Print
- DarkLight
Best Practices for Performance Troubleshooting
- Updated on 14 Mar 2024
- 5 Minutes to read
- Print
- DarkLight
Article Summary
Share feedback
Thanks for sharing your feedback!
Overview
Below are best practices for error handling for a Server in Production. Decisions provides some tools that can be used for finding issues and measuring performance. However some errors are best managed through outside services and recommendations are provided.
When using the different tools, keep in mind that each one looks at different areas of the platform. If a tool does not provide results that is a good thing because it eliminates one possible place that things are going wrong. Be a detective when troubleshooting. Any information is useful information.
Design/Process Errors
Process Errors are errors occurring at the Workflow level in Decisions. These errors can make their way into System Level Logs, but cannot necessarily be handled at the System Error Level.
Flows & Rules
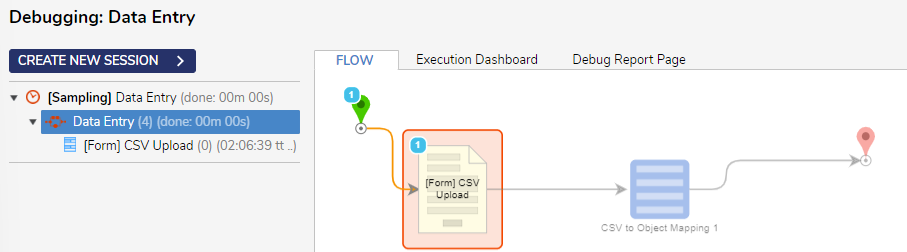
The Debugger is the first place to go to when addressing errors with Flows or Rules. There are many possible causes for errors in Flows, oftentimes these are related to input/output mapping, but any kind of error can be observed by noting the step highlighted in red and clicking to view the Show Exception Details.
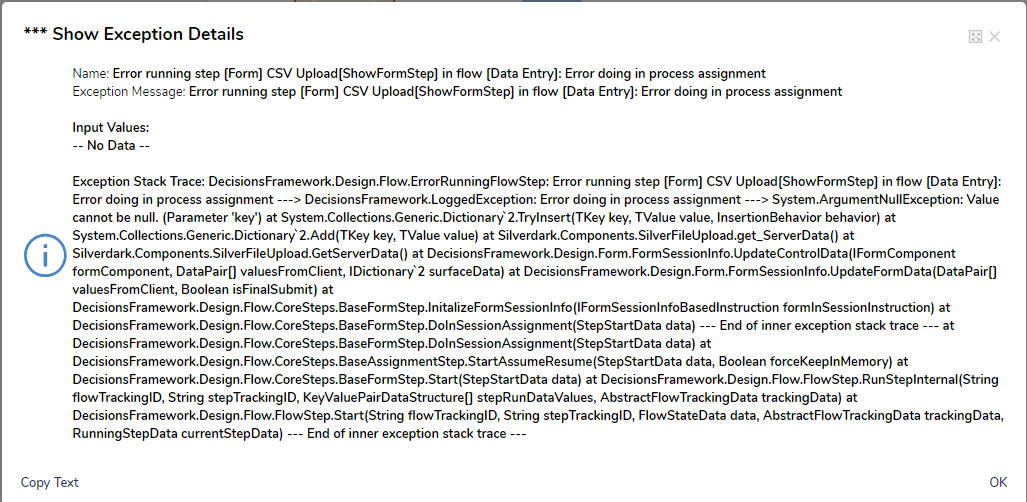
The Name section provides details on the exact step that threw the exception and the flow the step is in. The Exception Stack Trace is invaluable for determining the cause of the error. Most of the text is related to the backend code, however the answer can usually be found with careful examination. In the above example "System.ArgumentNullException: Value cannot be null" is the cause of the exception.
Stack Traces can also be found System > Administration > System Tools > Logging. The example from above is highlighted.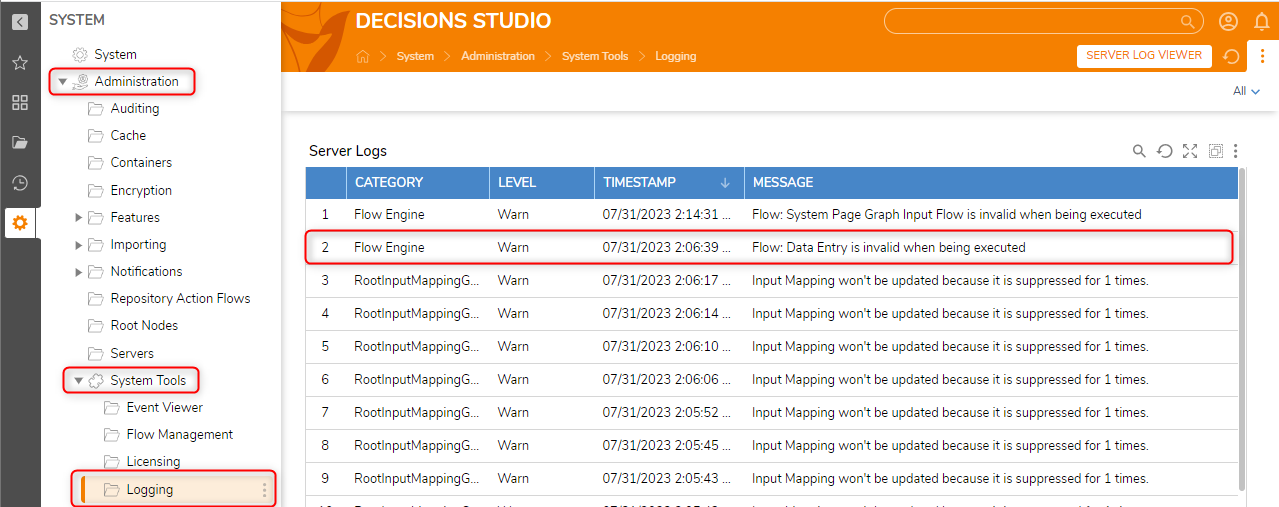
Additionally Flows can be designed to catch Unhandled Exceptions using either the Catch Exception step or the On Exception outcome path of a step. For more information, please visit the Exception Handling Best Practices article.
System Level Errors
Performance
There are three tools within Decisions to check performance - Event Viewer, Logs, and the Profiler. These tools can help check if projects are running at a needed speed and provide insight to where improvements can be made. For Enterprise level customers, Process Mining adds a fourth tool.
Event Viewer
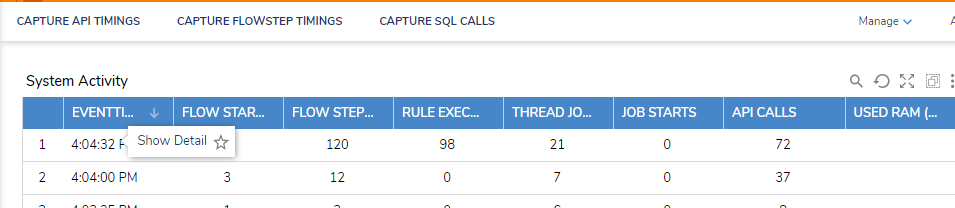
The first tool to use when running into performance issues is the Event Viewer. This is found under Administration > System Tools > Event Viewer. Then open System Activity. The System Activity report shows 30 second updates on various events happening within Decisions. The columns that are most relevant are Flow Starts, Rule Execution, and API Calls.
If either of those three columns have an out of the ordinary amount then they should be investigated further.
Right click on any line to pull up the Show Detail action and more information will be available.
.png)
 Right click to make Show Detail appear.
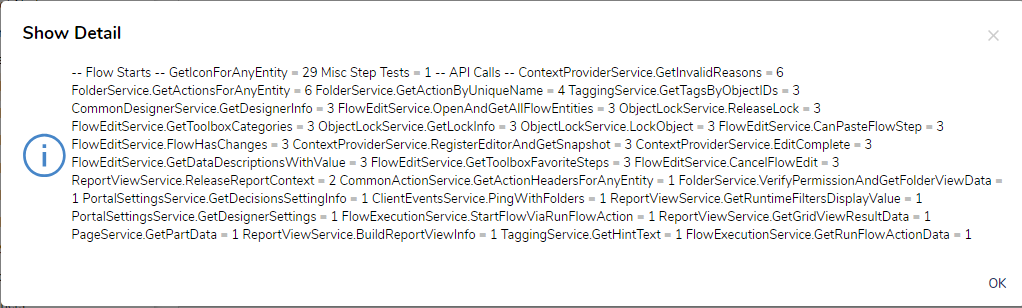 Information from the Show Detail option.
v8.13 and above
Starting in v8.13, the dashboard for the Event Viewer will no longer be accessible. The data is still recorded, and will be available in Logs.
Logs
Logs record historical information about what is happening with a Decisions' instance. For reviewing performance issues specifically, go to System > Administration > System Tools > Logging. Then do a search for the word 'took'. This filters to records that show how long steps and other functions took to execute. This time is how long it took the web application and the database to communicate with each other.
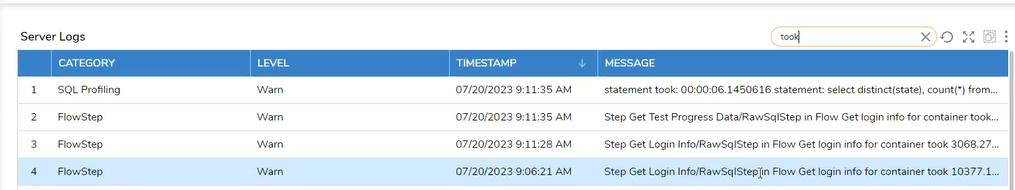
Anytime a step takes longer than one second to run a log entry will be created. The time recorded is in milliseconds. The time parameter can be configured as needed by editing the settings.xml file, specifically LogFlowStepsTakingMoreThanMilliseconds.

Finding non-performant steps can provide insight on which Flows might need to be changed to boost performance. Flows may be running too many records through a ForEach loop, for instance, and modifying the Flow with new logic can speed performance up.
Profiler
The Profiler stores execution data in memory. There are no historical records and the data rolls over every 15 minutes. What the Profiler is helpful for is gathering information as soon as an issue is identified. To access the Profiler from the System Folder, from the Designer navigate to System > Administration > System Tools > Profiler.
It is recommended to use the DOWNLOAD option and select Text View. Troubleshooting Using the Profiler has more specifics on how to read the file once it has been downloaded. The file can be used to identify areas of slowness.
Performance
The Profiler can impact performance. For steps to disable the Profiler go to Troubleshooting Using the Profiler.
Process Mining
Process Mining (available only to Enterprise level customers) can provide more insight into how a process is running and where improvements in Flow design would make sense. It also does this with an easy to follow graphical presentation.
Log Analytics
One way to manage other kinds of system errors is to use a Log Ingestion Tool. These software tools are capable of reading into errors from Decisions at a more granular level than Decisions exception handling. They take in Logs from Decisions and other sources, filtering out unnecessary information and combining the relevant pieces to provide detailed System Level information for an Error Event.
For these tools to be beneficial, they need to be configured to ingest more than just the Decisions Logs. A Log Ingestion Tool could be configured to take in data from the Decisions Service Host Manager Logs, IIS Logs, LM Logs, Event Viewer Logs, SQL Server Logs, etc. Many of these tools will generate Reports on the information collected from Error Events.
Tool Name |
| Splunk |
| Rollbar |
| Papertrail |
| DataDog |
| Prometheus |
| Azure Log Analytics |
Decisions-hosted servers and Datadog
Users who are hosted by Decisions and wish to use Datadog must meet the following requirements:
- They must be a Premium Support customer
- They must submit written request from the product license owner
- They must provide the Datadog API Key
- They must create a read-only account on their Datadog that provides Decisions access. The email to be used is itops@decisions.com
Uptime
The Decisions Login page shows an error and exception message when Service Host Manager is down to inform the user that the service cannot be reached, not as a form of monitoring. It is recommended to use an Uptime Monitoring Tool to monitor the status of the site.
These tools check a web page at regular time intervals (usually every five to 15 minutes), then monitor the response. If the response returns an Error or the request couldn’t reach it, the tool sends notifications to inform of the outage so that the Administrator can take appropriate action.
| Recommended Uptime Monitoring Tools |
|---|
| UptimeRobot |
| Nodeping |
| Pingdom Service Uptime Host |
For further information on Administration, visit the Decisions Forum.
Was this article helpful?